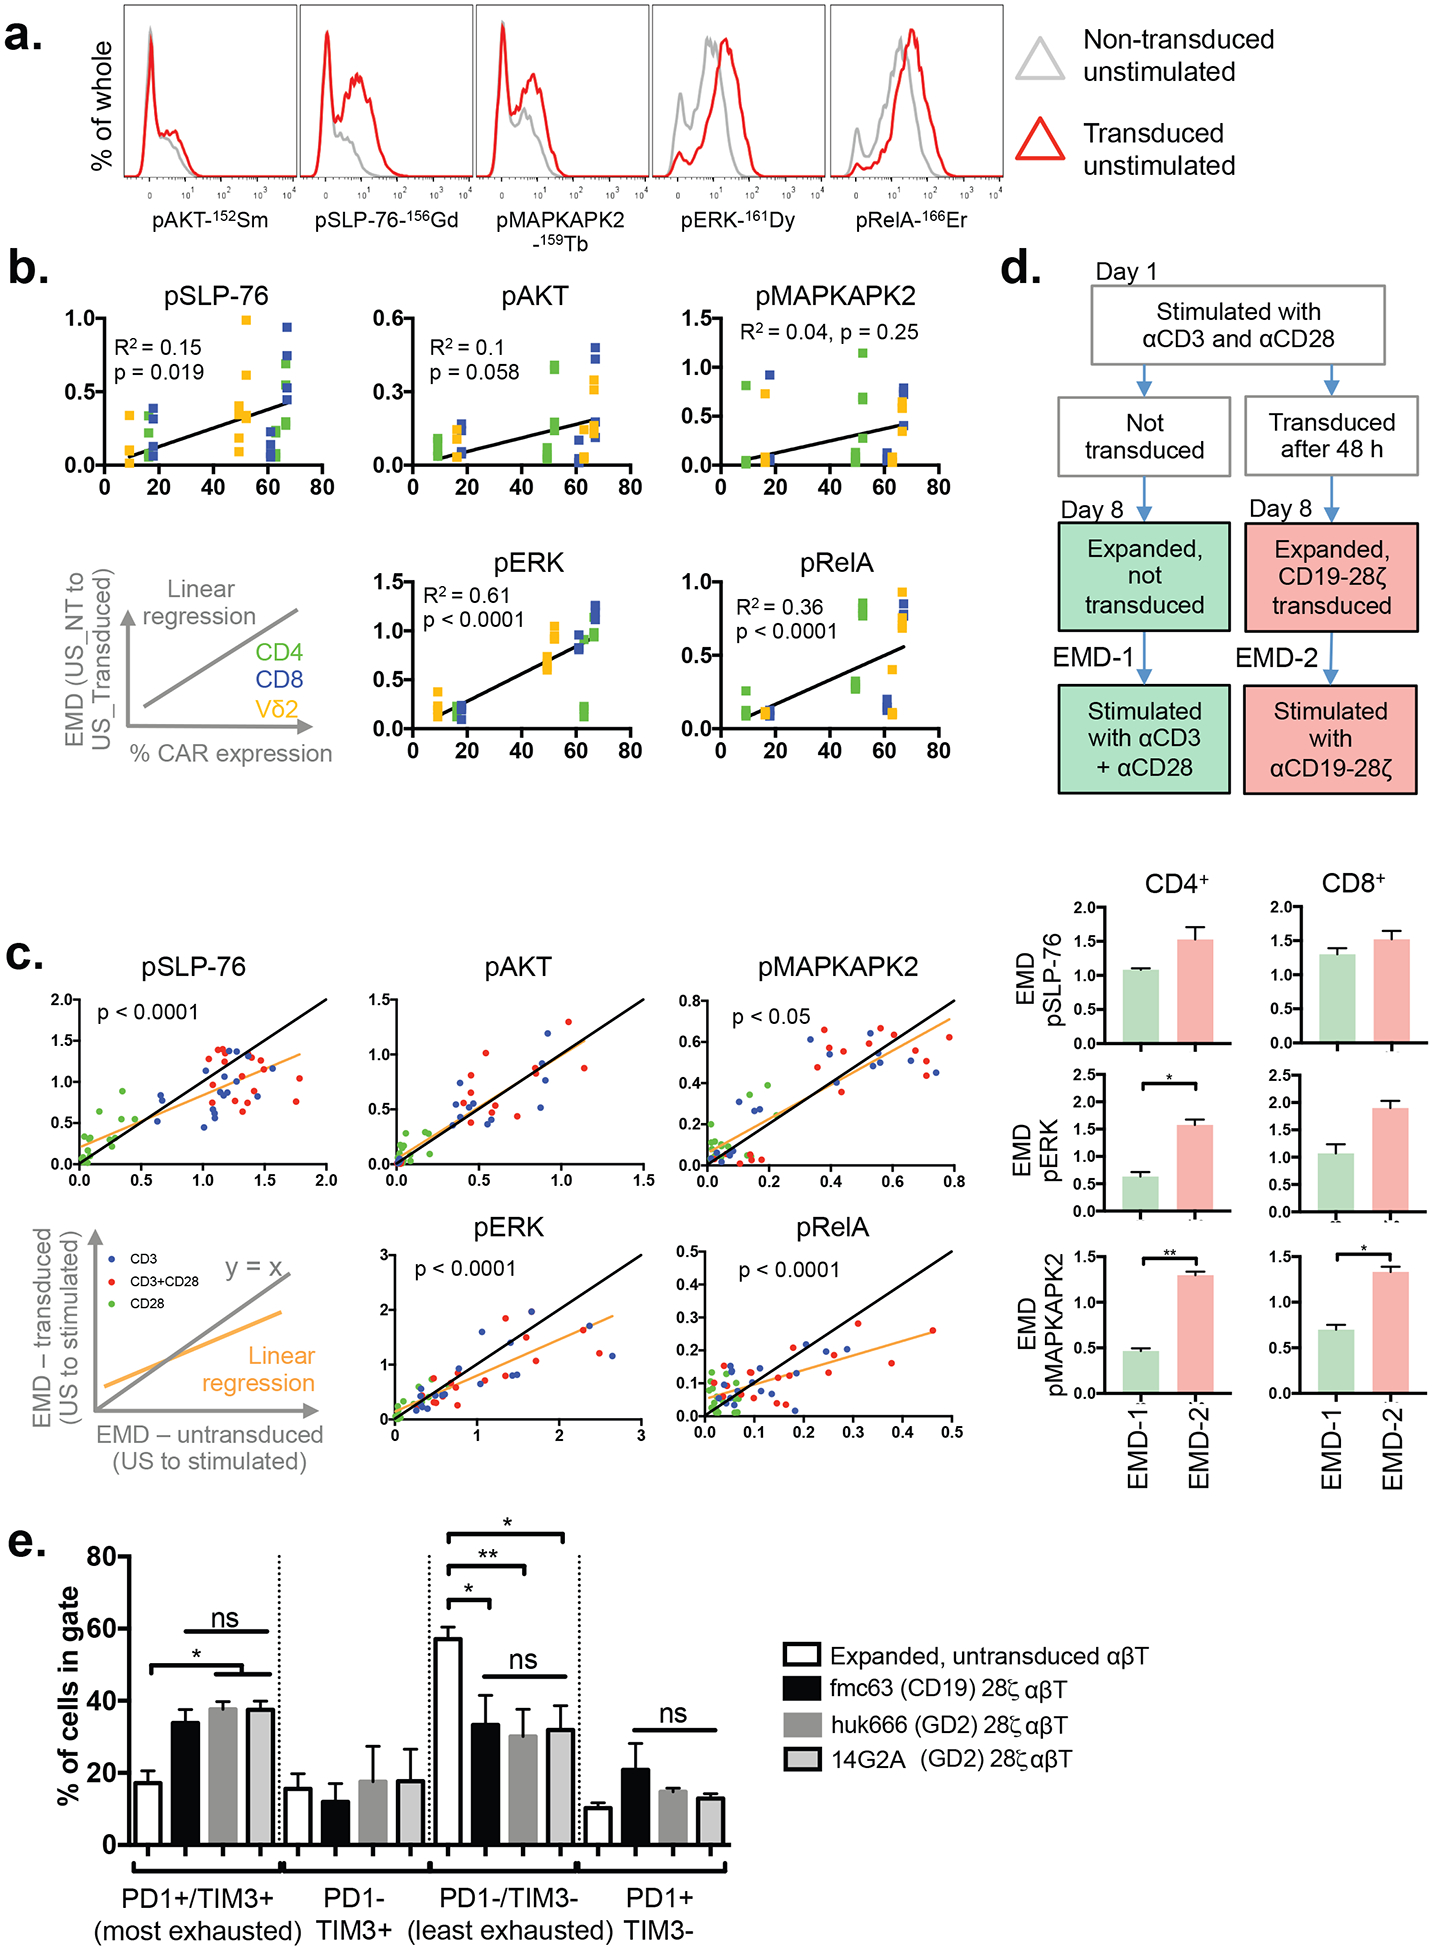
Figure 2. CAR expression leads to tonic activation of signaling networks.

A) Baseline phospho-protein expression in CD8+ T-cells transduced to express the CD19–28ζ CAR compared to untransduced controls. Representative data from one of three independent donors.
B) EMD scores for baseline (unstimulated) phospho-protein expression calculated between T-cells (CD4+, CD8+ or CD4−/CD8−/Vδ2+) transduced with CD19–28ζ and donor-matched untransduced controls from the same T-cell subset, and plotted against transduction efficiency (% of transduced cells expresssing CAR). Each point represents an EMD score for a T-cell subset in an individual donor (n=3). The points are colored to indicate the T-cells subset (CD4: green, CD8: blue, Vδ2: yellow). Pearson R2 values and p-values for the Pearson correlation are provided. US: unstimulated, NT: non-transduced.
C) Comparison of phospho-protein abundance upon CAR transduction. Expanded T-cells transduced with CD19–28ζ and donor-matched expanded, untransduced controls were stimulated by αCD3, αCD28 or αCD3+αCD28 for 60s, 180s or 360s. Donor, stimulus, T-cell subset and time-matched EMD scores for transduced and untransduced samples are plotted against each other. The color of the points indicates the stimulus provided (blue: CD3, red: CD3+CD28, green: CD28). The yellow line shows the linear regression; black line, y = x. p-values indicate significant differences in slope determined by ANOVA. US, unstimulated. Data from 3 independent donors.
D) Signal strengths of responses produced from CD3+CD28 stimulus in untransduced cells and from CD19–28ζ CAR stimulus in donor-matched transduced T-cells. Untransduced cells were used as the comparator in this case because higher baseline phospho-protein levels in transduced cells reduce the responsiveness of CD19–28ζ CAR-T cells to stimulus of their native receptors (C). Values represent mean±SEM of EMD scores, n=3.
E) TIM3 and PD1 exhaustion marker levels in T cells expressing a CD19–28ζ, GD2–28ζ (huk666) or GD2–28ζ (14G2A) CAR. The gating for TIM3/PD1 are shown in Supplementary Figure S11, bars represent mean + SEM for n = 18 for non-transduced and n = 4 for each CAR.
