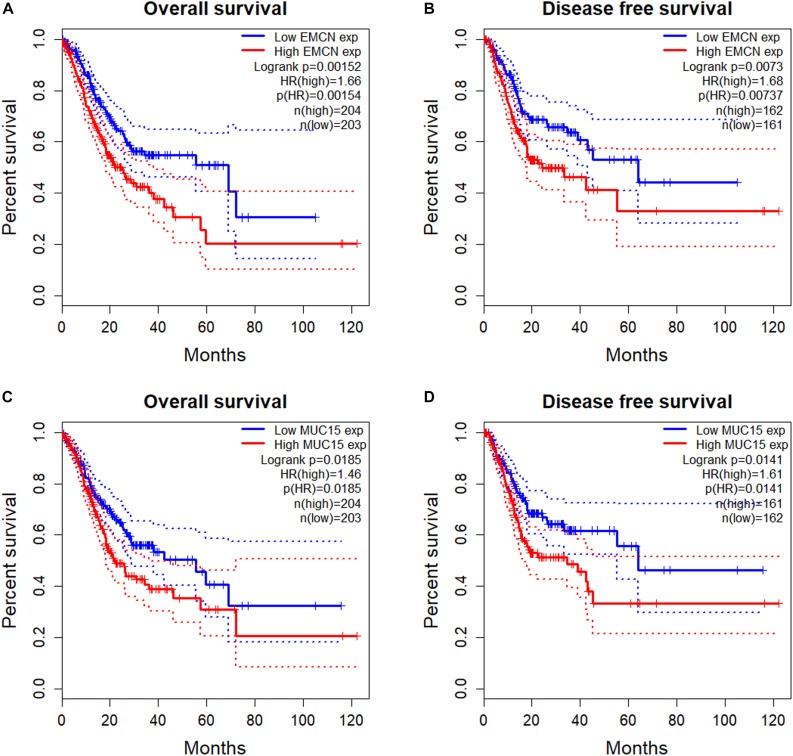
FIGURE 1.
Survival analysis of TCGA STAD samples for prognostic potentials of EMCN (MUC14) and MUC15. (A) Overall Survival (OS) of EMCN. (B) Disease Free Survival (DFS) of EMCN. (C) Overall Survival of MUC15. (D) Disease Free Survival of MUC15. Log rank p-values, hazard ratios (HRs) and hazard ratio p-values were calculated. The 95% confidence intervals for survival time were shown in as dotted lines in the Kaplan–Meier (KM) survival plot.

