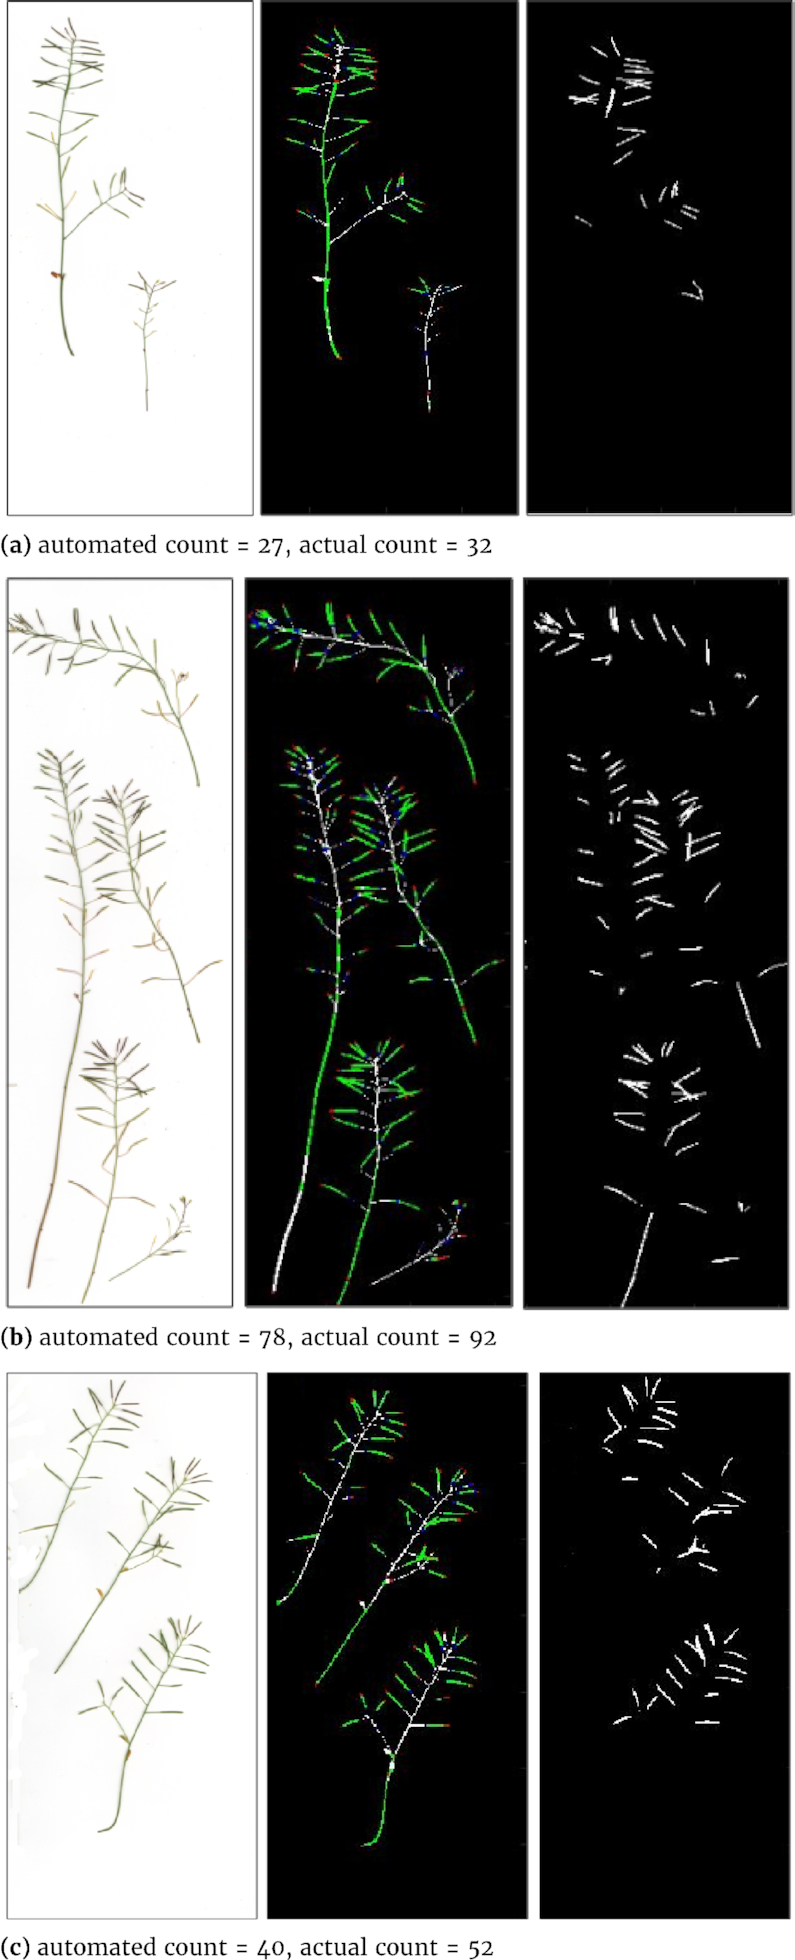
Figure 12.

Results of the DenseNet framework applied to some random samples from the larger testing dataset. From left to right: original plant images, sub-patch labelling and image reconstruction (Tips, bodies, bases, and stems are indicated in red, green, blue, and white, respectively), and silique region detection (in white).
