Figure 11.

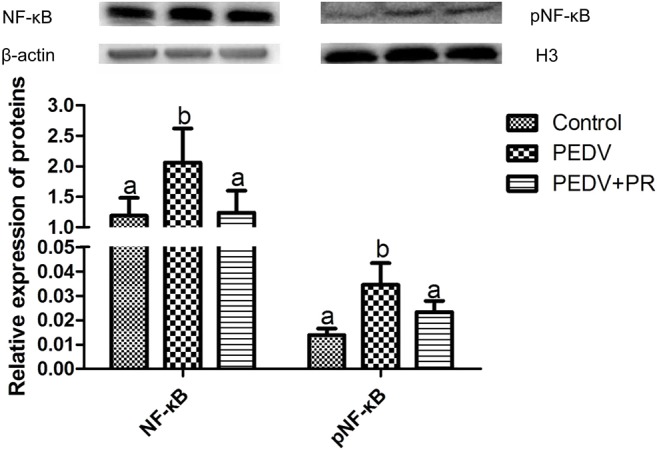
Relative expression of NF-κB and pNF-κB in the ileum by the Western blot analysis. Values are mean and SD, n = 8. a,bValues with different letters for the same protein are different (P < 0.05). n = 8.

Relative expression of NF-κB and pNF-κB in the ileum by the Western blot analysis. Values are mean and SD, n = 8. a,bValues with different letters for the same protein are different (P < 0.05). n = 8.