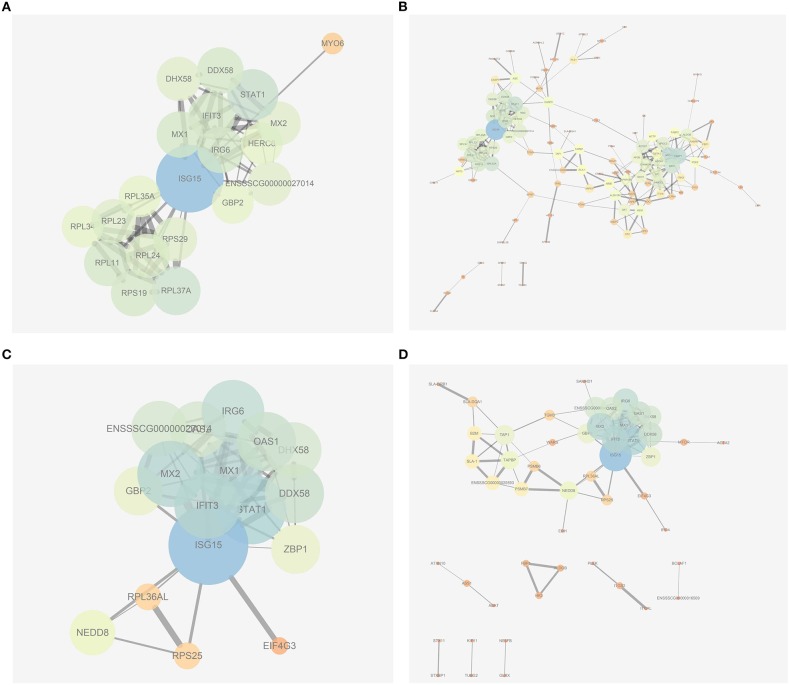
Figure 9.
Protein–protein interaction networks built by using the online software String and Cytoscape. (A) The most significant part of networks from the PEDV group vs. the Control group. (B) An overview of networks from the PEDV group vs. the Control group. (C) The most significant part of networks from the PEDV + PR group vs. the PEDV group. (D) An overview of networks from the PEDV + PR group vs. the PEDV group. n = 4.

