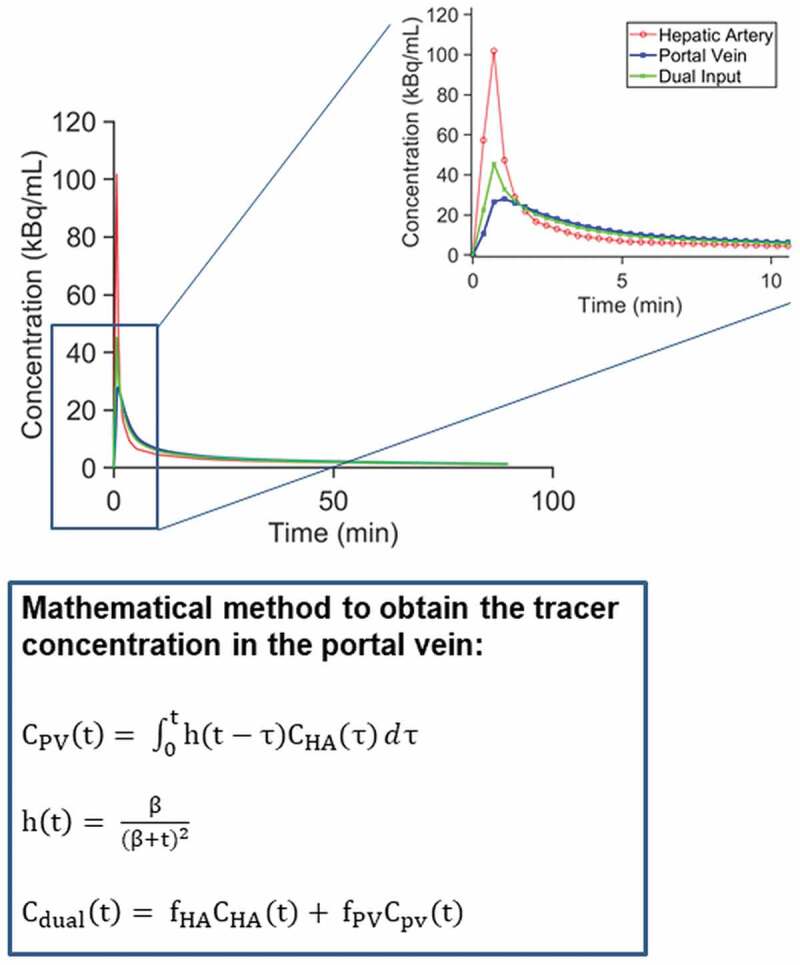
Figure 3.

Representation of [11C]erlotinib radioactivity concentration in the radial artery (assumed to be equal to the concentration in the hepatic artery), in the mathematically-derived portal vein and in the estimated dual input function in one representative subject. The enlarged graph section shows only the first 10 min of the PET scan duration for which the difference in concentration is larger between arterial and venous hepatic blood. The equations depicted below the graph show the mathematical method implemented to estimate the radiotracer concentration in the portal vein. The concentration in the portal vein along time, CPV(t), can be calculated as the convolution integral between the concentration in the hepatic artery, CHA(t), and the impulse-response function, h(t) as described in the first equation. This impulse-response function (second equation) is mainly characterized by the parameter β which determines the mean transit time for the passage of radiotracer from the intestine to the portal vein. Finally, as indicated in the third equation, the total concentration in the liver sinusoids (dual input function, Cdual(t)) can be represented as a flow-weighted function which takes into account the hepatic artery flow fraction (fHA, ~0.25) and the portal vein flow fraction (fPV, ~0.75).
