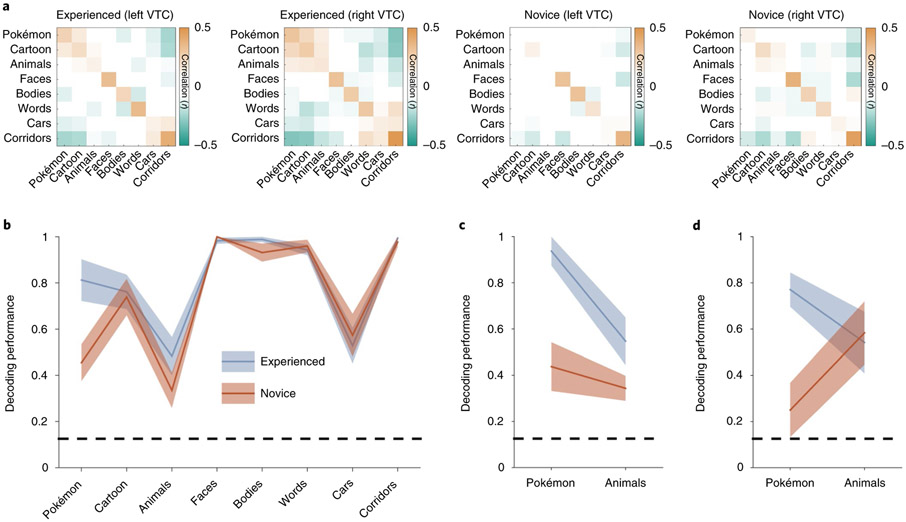
Fig. 2 ∣. Experienced participants demonstrate a consistent and distinct representation for Pokémon compared to novices.
a, RSMs calculated by correlating distributed responses (z-scored voxel betas) from an anatomical VTC ROI across split halves of the fMRI experiment. Positive values are presented in orange, negative values in green and near-zero values in white (see the colour scale, which applies to all four RSMs). b, The decoding performance from the winner-takes-all classifier trained and tested on split halves of the fMRI data from the bilateral VTC. The shaded region shows s.e.m. across participants within a group (experienced participants, n = 11; novices, n = 11). The dashed line indicates the chance level performance; decoding performance is represented as a fraction of 1, with 1 corresponding to 100% decoding accuracy. c,d, The decoding performance from distributed bilateral VTC responses for experienced (n = 4) and novice (n = 5) participants in the original oddball task (c) and when brought back to undergo an additional fMRI experiment with an attention-demanding two-back task (d). The same participants are shown in c and d.

