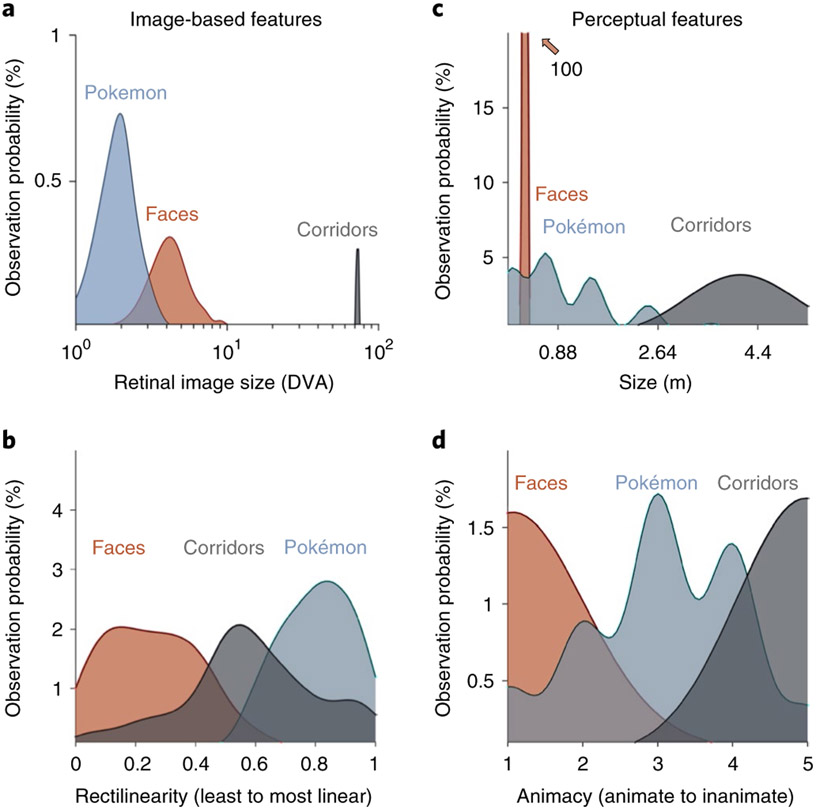
Fig. 4 ∣. Different visual feature statistics predict different cortical locations for Pokémon.
a, Distributions of retinal image sizes produced by Pokémon (blue), faces (orange) and corridors (grey) in a simulation that varied viewing distance across a range of sample stimuli. DVA, degrees of visual angle. X axis shows log-scale DVA. b, Distributions of the relative rectilinearity scores of faces, corridors and Pokémon, as measured using the Rectilinearity Toolbox25 (0, least linear; 1, most linear). c, Distributions of the perceived physical size of Pokémon (from 28 raters) and of the physical sizes of faces and corridor stimuli. The distributions of face and corridor size were produced using Gaussian distributions with standard deviations derived from either anatomical or physical variability within the stimulus category (see Methods). The face distribution extends to a value near 100% (the natural variation of face size is very narrow compared to other stimuli). d, Distributions of the scores of perceived animacy collected from a group of 42 independent raters who rated the stimuli of faces, Pokémon and corridors for how ‘living or animate’ these stimuli were perceived to be (1, animate; 5, inanimate).

