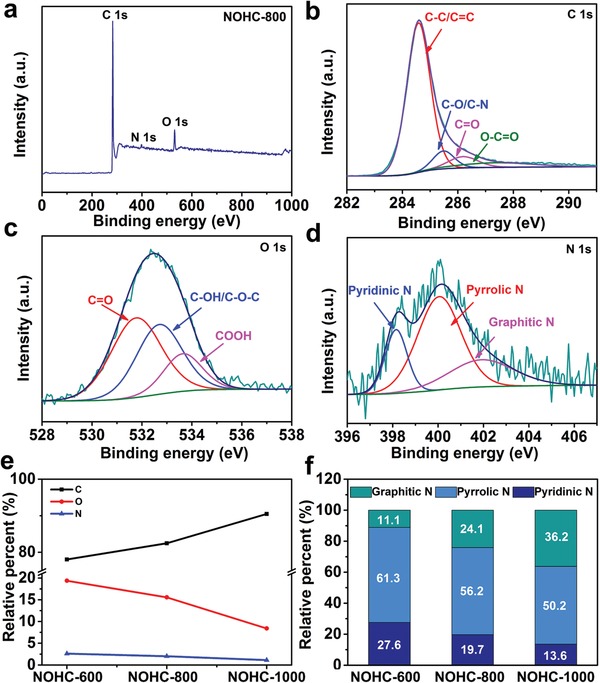
Figure 3.

XPS spectra for NOHCs. a) The survey spectrum of NOHC‐800. b–d) The high‐resolution XPS spectra of C 1s, O 1s, and N 1s for NOHC‐800, respectively. e) The contents of C, N, and O in NOHCs. f) The contents of different species of N in NOHCs.
