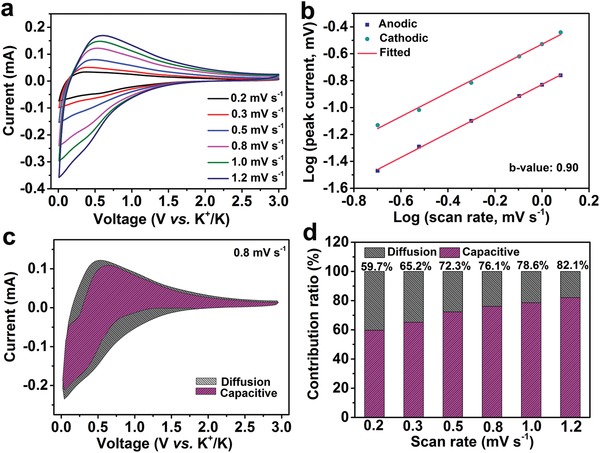
Figure 5.

Quantitative analysis of potassium‐ion storage in NOHC‐800. a) CV curves at various scan rates from 0.2 to 1.2 mV s−1. b) The measurement of b‐value. c) Contribution of the capacitive and diffusion process at a scan rate of 0.8 mV s−1. d) Contribution ratios of the capacitive process at different scan rates.
