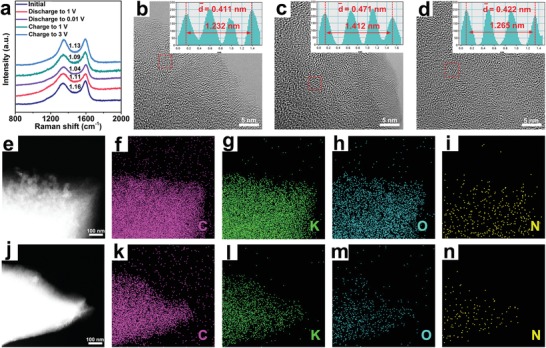
Figure 6.

a) Ex situ Raman spectra of NOHC‐800 at various potassiation states. b–d) Ex situ HRTEM images of NOHC‐800 at initial, discharge, and charge states, respectively. e–i) EDS elemental mappings of C, K, O, N elements in NOHC‐800 at the discharge state. j–n) EDS elemental mappings of C, K, O, N elements in NOHC‐800 at the charge state.
