
Figure 2.
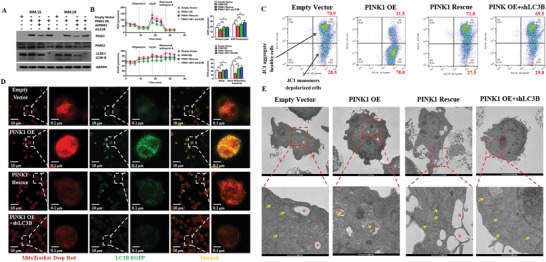
Overexpression of PINK1 induces mitophagy. A) Western blot analysis of PINK1, PARK2, and LC3B protein levels in MM cells under different gene transductions. MM cells were transduced with empty control vector, PINK1 overexpressing vector (PINK1 OE), PINK1 overexpressing vector followed by transduction with PINK1 specific shRNA (PINK1 rescue), or PINK1 overexpressing vector followed by transduction with LC3B specific shRNA (PINK1 OE + shLC3B). B) Mitochondrial respiration. OCR and ECAR were measured using seahorse XF. X‐axis represented total running time, while Y‐axis represented OCR or ECAR (for a total of 25 000 MM.1S myeloma cells). Proton leak, ATP production and spare respiratory capacity were calculated. Data represented mean ± SEM, n = 4–6. *p < 0.05, **p < 0.01, and ***p < 0.001. C) PINK1 overexpression induces mitochondrial membrane depolarization. Mitochondrial membrane depolarization was measured by JC1 MitoProbe. MM cells were transduced with empty control vector, PINK1 OE vector, PINK1 rescue, or PINK1 OE + shLC3B. One of the three representative experiments was shown. Upper right quadrant represented cells with normal mitochondrial potential and right lower quadrant represented cells having depolarized mitochondria. D) Confocal microscopy of the fusion of mitochondria and lysosome. After transduction with various vectors mentioned above, the cells were then transduced with MitoTracker (deep red color) and LC3B‐eGFP (green color) constructs. The fusion of mitochondria and lysosomes revealed as yellow color on the merged images. E) TEM imaging of the fusion of mitochondria and lysosome. Mitophagy (i.e., the fusion of mitochondria, represented as red asterisks, with lysosome, represented by yellow arrows) was detected by TEM in the cells described above.