
Figure 4.
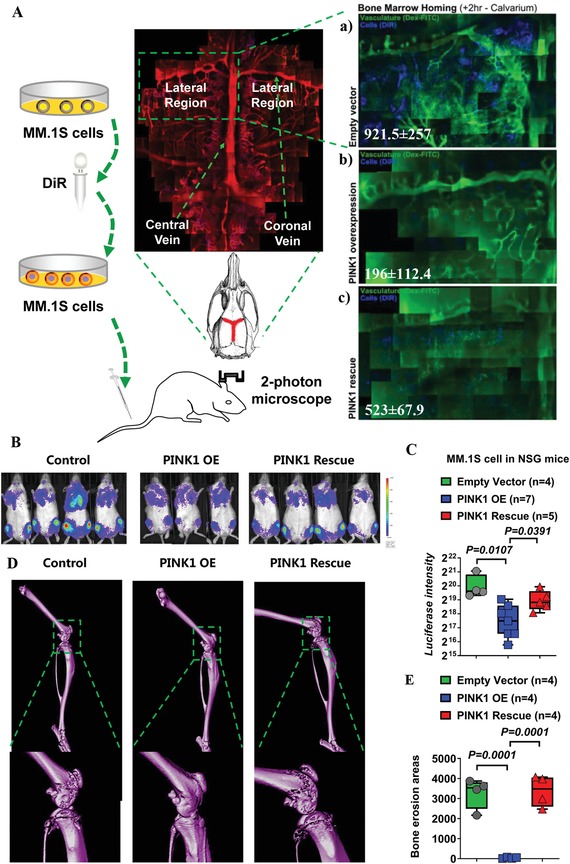
PINK1‐dependent mitophagy inhibits myeloma cell homing and tumor development in vivo. A) Intravital imaging for the measurement of myeloma cell homing and migration. MM.1S cells were transduced by empty vector, PINK1 overexpressing vector (OE), or PINK1 overexpressing vector followed by transduction with PINK1 specific shRNA. The cells were labeled with DiR fluorescent dye and injected via tail vein into NSG mice (0.5 × 10⁶ cells per mouse). A confocal microscopy was used to scan the mouse calvarium including the central sinus and the surrounding bone marrow cavities. High‐resolution images were obtained through the intact mouse skull and captured with Leica LAS‐AF software. DiR+ myeloma cells observed in the vasculature and in the bone marrow space were visualized at 2 h after cell injection. Green: Dex‐FITC vasculature. Blue: DiR+ myeloma cells. a) MM cells transduced with control vector. b) MM cells transduced with PINK1 OE vector. c) MM cells transduced with PINK1 OE vector followed by PINK1 shRNA (PINK1 rescue). One of the three representative experiments was shown. B–E) PINK1‐dependent mitophagy regulated myeloma cell in vivo tumorigenesis. MM cells were transduced with control vector, PINK1 OE vector, or PINK1 OE + PINK1 shRNA (PINK1 rescue), and injected i.v. into NSG mice. B) Forty‐five days later, tumor burden was measured by luciferin bioluminescence imaging. C) Statistical analysis of luciferin bioluminescence intensity in NSG mice xenografted with MM cells transduced with empty vector, PINK1 OE vector, or PINK1 rescue vector. Data represented mean ± SEM, n = 4–7. D) Bone structure was measured by micro‐CT. E) Statistical analysis of bone erosion in NSG mice xenografted with MM cells transduced with empty vector, PINK1 OE vector, or PINK1 rescue vector. Data represented mean ± SEM, n = 4–7.