
Figure 8.
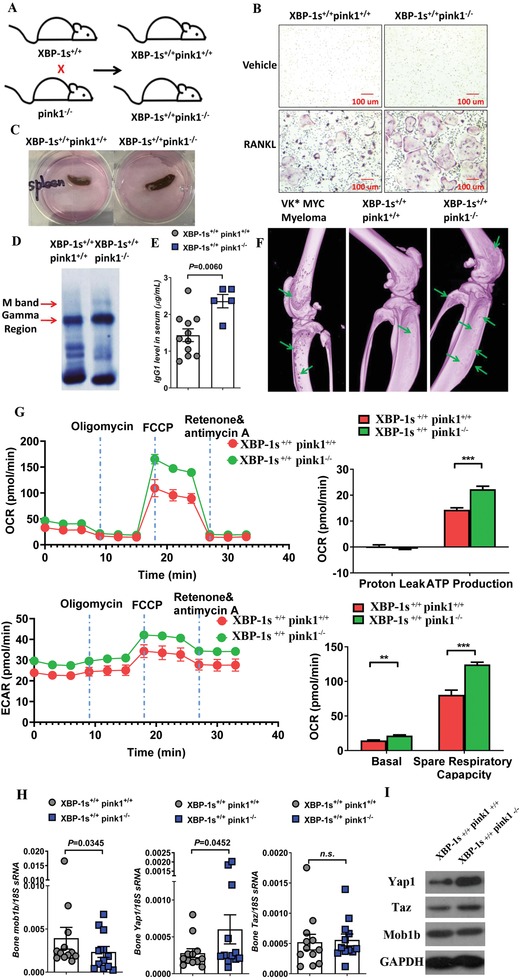
Pink1 deletion accelerates myeloma development and progression in XBP‐1s transgenic mice. A) Schematic diagram of crossbreeding XBP‐1s+/+ mice with pink1−/− mice to generate the XBP‐1s+/+ pink1−/ − mice. B) Bone marrow osteoclast differentiation from XBP‐1s+/+ pink1−/− and XBP‐1s+/+ pink1+/+ mice. Representative TRAP staining after 6 day of differentiation. C) Representative image of mouse spleen from XBP‐1s+/+ pink1+/+ (left) and XBP‐1s+/+ pink1−/− (right) mice. D,E) Serum protein electrophoresis with D) the gamma protein and M spike indicated and E) the serum IgG1 level from XBP‐1s+/+ pink1+/+ and XBP‐1s+/+ pink1−/− mice. Data represent mean ± SEM. *p < 0.05. F) Micro‐CT imaging of the tibiae and femur from VK*MYC myeloma (left), XBP‐1s+/+ pink1+/+ (middle), and XBP‐1s+/+ pink1−/− (right) mice. Green arrows indicated bone punch lytic lesions. G) Mitochondrial respiration by seahorse assay using bone marrow cells harvested from XBP‐1s+/+ pink1+/+ and XBP‐1s+/+ pink1−/− mice. H) Bone marrow Mob1b, Yap1, and Taz mRNA expression harvested from XBP‐1s+/+ pink1+/+ and XBP‐1s+/+ pink1−/− mice measured by RT‐PCR. I) Protein expression of Mob1b, Yap1, and Taz in XBP‐1s+/+ pink1+/+ and XBP‐1s+/+ pink1−/− mice was measured by Western blot.