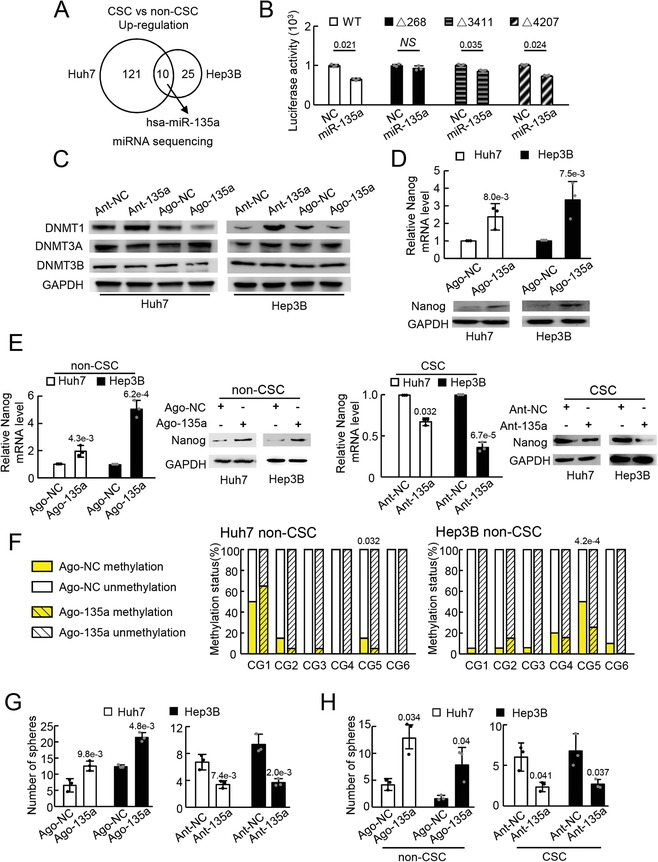
Figure 2.

miR‐135a activated Nanog expression and enhanced the CSC capacity of tumor cells by targeting DNMT1. A) Schematic of upregulated miRNAs in CSCs compared with non‐CSCs screened by miRNA sequencing. Two biological replicates for each group were sequenced. Gene expression with a fold change >2 and false discovery rate < 0.05 was identified as significantly different. B) Binding of miR‐135a to DNMT1 mRNA sequence assessed by a dual‐luciferase assay in triplicate. C) DNMT protein expression in tumor cells with miR‐135a upregulation (Ago‐135a) or miR‐135a downregulation (Ant‐135a) analyzed by WB in triplicate. D) Nanog expression in tumor cells with miR‐135a upregulation (Ago‐135a) or the control (Ago‐NC) analyzed via qRT‐PCR and WB in triplicate. E) qRT‐PCR and WB analysis of Nanog expression in non‐CSCs with miR‐135a upregulation (Ago‐135a) and in CSCs with miR‐135a downregulation (Ant‐135a). F) Methylation pattern of the Nanog promoter in non‐CSCs with miR‐135a upregulation (Ago‐135a) or the control (Ago‐NC) assessed by BSP analysis. Twenty clones were sequenced for each CG in the Nanog promoter. G) Counts of spheres derived from tumor cells with miR‐135a upregulation (Ago‐135a) and miR‐135a downregulation (Ant‐135a) analyzed via sphere formation assay. H) Counts of spheres derived from non‐CSCs with miR‐135a upregulation (Ago‐135a) and CSCs with miR‐135a downregulation (Ant‐135a) analyzed via sphere formation assay. B–E) Representative data of triplicate experiments or of G,H) five fields in one of three experiments are shown as the mean ± SD. B,D,E,G,H) P value was assessed by Student's t test or F) Fisher's exact test. NS, no significant difference. Representative images of triplicate WB experiments are shown.
