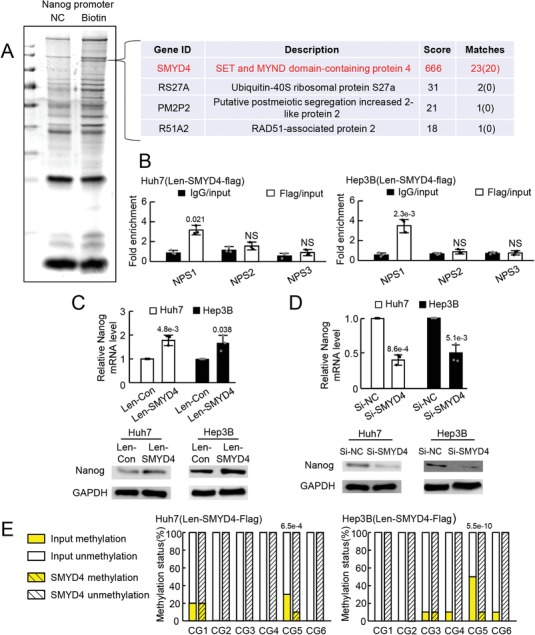
Figure 4.

SMYD4 upregulated Nanog expression by binding to the unmethylated Nanog promoter. A) Proteins binding to the Nanog promoter identified by DNA pull down and mass spectrometry analyses. Representative images from triplicate experiments are shown. NC, negative control, no biotin labeled; Biotin, biotin labeled. B) ChIP analysis showing the binding of SMYD4 to the Nanog promoter. NPS1, Nanog promoter sequence including CG5; NPS2, and NPS3, Nanog promoter sequence out of NPS1. NS, no significant difference. Expression of Nanog in tumor cells with C) SMYD4 upregulation and D) downregulation assessed by qRT‐PCR and WB in triplicate. Representative data from triplicate experiments are shown as the mean ± SD. E) Methylation of CGs from sequences enriched by SMYD4 and input controls assessed by BSP analysis. Ten clones were sequenced for each CG in the Nanog promoter. P value was assessed by B–D) Student's t test or E) Fisher's exact test.
