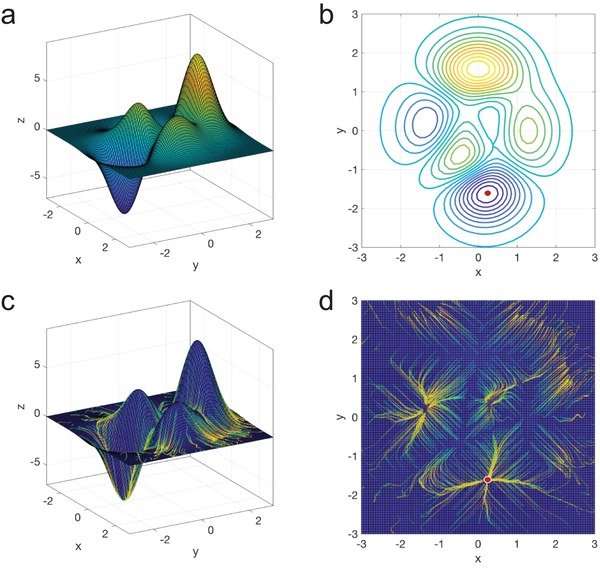
Figure 2.

The nonconvex surface of the peaks function and the solution paths obtained using GIDNs. a) The 3D landscape of the peaks function shows several hills and valleys; b) The contour plot of the peaks function shows several local minima and maxima in the functional space. The red dot represents the location of the global minimum; c) The 3D solution paths obtained by using GIDNs starting with 1000 random initial points. The beginning of the solution paths is shown in green and the end is shown in yellow; d) The solution paths shown in 2D. Many of the solution paths are converged to the global minimum (red dot).
