
Figure 4.
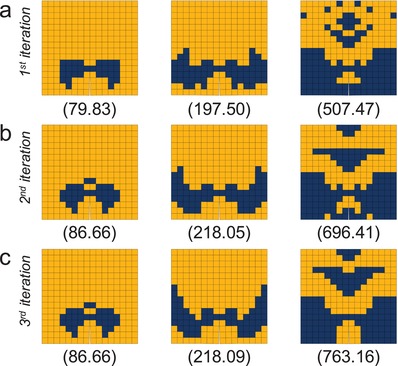
The inverse designs generated using GIDNs for a 16 by 16 composite system. a) The inverse designs generated in the first‐iteration design process for the volume fractions of 12.5%, 25%, and 50% (left to right), respectively. The numbers below indicate the corresponding toughness values; b) The inverse designs generated in the second‐iteration design process; c) The inverse designs generated in the third‐iteration design process.