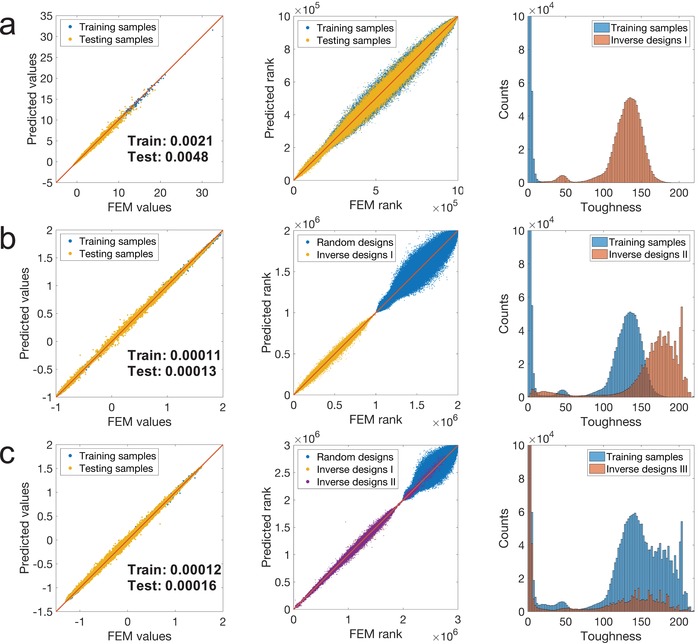
Figure 5.

The statistical analysis results of prediction accuracy and inverse design performance. a) The statistical analysis results for the first‐iteration training and design processes. The subfigures from left to right are the comparison of the ML predicted values and FEM values, the comparison of the ML predicted ranking and FEM ranking, and the histogram of the training samples and inverse designs. b) The statistical analysis results for the second‐iteration training and design processes. c) The statistical analysis results for the third‐iteration training and design processes.
