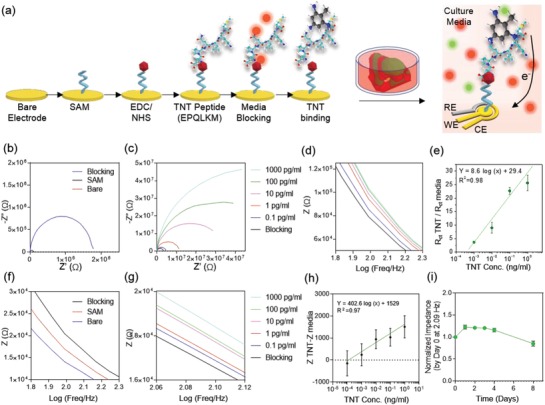
Figure 6.

Biosensing mechanism and procedure. a) Schematic diagram of the functionalization procedure of the biosensor using the TNT‐specific peptide. b,c) Nyquist plot of measurement using different concentrations of TNT, sensing using ferrocyanide. Upon capturing TNT by the peptide, impedance increases in the ferrocyanide‐based measurement system. d) Bode plots using 0.1–1000 pg mL−1 TNT, sensing using ferrocyanide. Plots (c) and (d) share the same legend. e) Calibration curve for TNT sensing using ferrocyanide. f) Nyquist plots of measurement using 10 pg mL−1 of TNT, sensing using culture media. g) Bode plots using 0.1–1000 pg mL−1 TNT, sensing using culture media. h) Calibration curve for TNT sensing using cell culture media. i) Diagram of degradation of TNT peptide over 8 days of incubation at 37 °C.
