Figure 6:
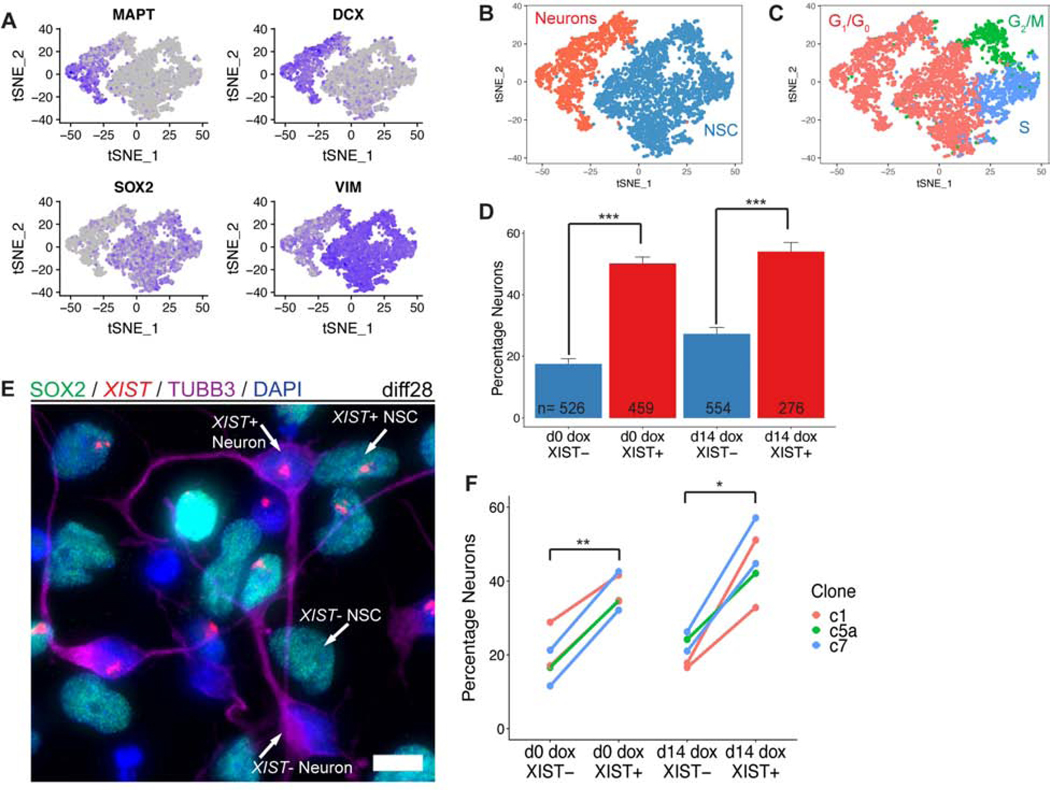
XIST expressing cells are more likely to be neurons than cells that do not express XIST. a) t-distributed stochastic neighbor embedding (t-SNE) plot of diff28 scRNAseq data for neuron- (MAPT and DCX) and NSC- (SOX2 and VIM) specific genes. Gray is lowly expressed and purple is highly expressed. Each dot represents a single cell. b) t-SNE plot colored for cell type classification. c) t-SNE plot colored for predicted phase of cell cycle. d) Fraction of cells in Clone5a d0 and d14 dox scRNAseq samples identified as neurons separated based on XIST expression. Error bars are SE. e) Combined RNA FISH for XIST with IF for SOX2 and TUBB3 in day 28 cells. Example XIST+/−;NSC/Neuron cells are labeled. Micrograph is a maximal intensity projection of a 3D z-stack. Scale bars are 10μm. f) Quantification of (e) for 1–2 differentiations of three transgenic clones. For statistical comparisons, differentiations of the same clone were averaged together and treated as one sample (n=3). Lines connect data points derived from the same sample. Between 419–1311 cells were analyzed for each sample (median = 868). *p ≤ 0.05, **p ≤ 0.01; Student’s paired T-test.

