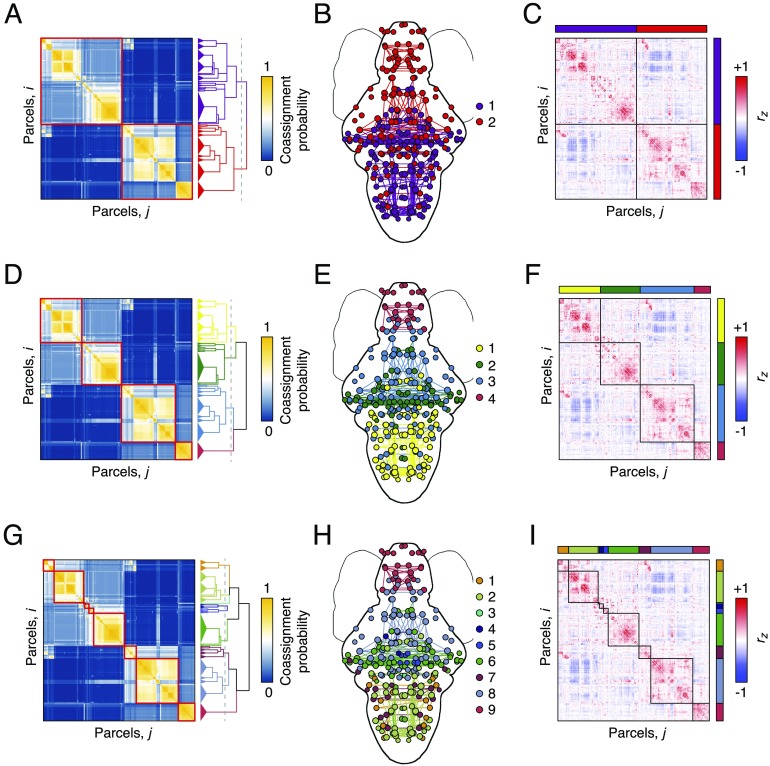
Figure 2. .
Hierarchical and multiresolution modular structure. (A) Coassignment matrix with hierarchy cut to highlight a two-module division (red blocks). (B) Modules plotted in anatomical space. Nodes are colored according to their module assignment, and within-module connections are colored similarly. (C) Correlation matrix ordered and blocked to highlight modular structure. Panels D–F and G–I show similar figures but with the number of modules equal to four and nine, respectively.

