Figure 3. .
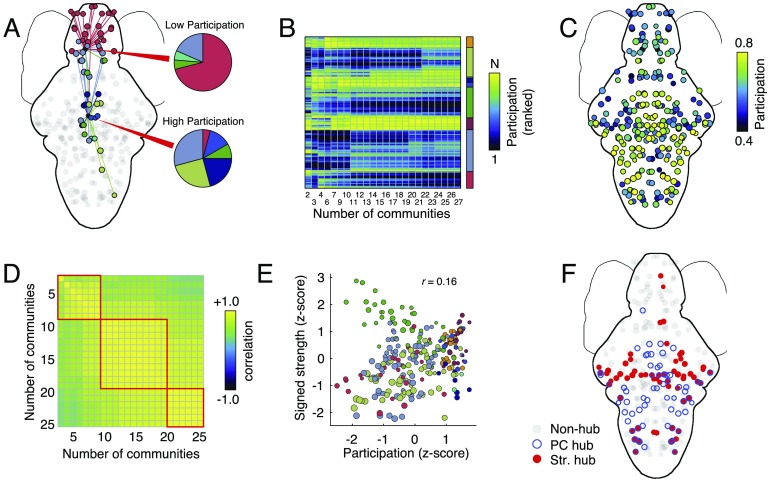
Participation coefficient and hub classification. (A) Schematic illustration of low- and high-participation nodes. Connections made by nodes with low participation (nonhubs) are concentrated within those nodes’ modules; connections made by nodes with high participation (hubs) are distributed across many modules. (B) Mean participation coefficient (ranked) as a function of the number of detected modules. (C) Average participation coefficient when the number of modules ranges from 2 to 25. (D) Correlation of brain-wide participation coefficient maps for different numbers of modules. While the changes in participation coefficient maps are subtle, there nonetheless appear to be three “regimes” (based on visual inspection) corresponding to distinct patterns of participation. (E) Participation coefficient and signed strength, z-scored and plotted against one another. Both measures serve as indices of “hubness” but are, on average, only weakly correlated. (F) Nodes in the top 25th percentile by participation and absolute strength. On average, there is little overlap.

