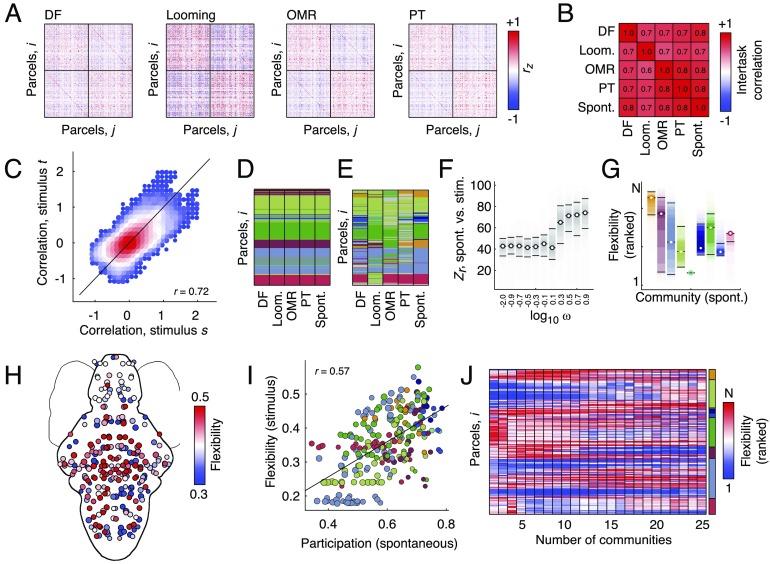
Figure 4. .
Comparing spontaneous and stimulus-evoked network architecture. (A) Functional connectivity matrices for four different stimulus conditions: dark-flash (DF), looming, optomotor response (OMR), and phototaxis (PT). (B) Upper triangle correlation for four stimulus conditions + spontaneous. (C) Scatterplot of all stimulus conditions plotted against one another. Size and color of each point indicate density of points at that location. Examples of (D) low-flexibility and (E) high-flexibility modules. In D and E, modules have been recolored to match the nine-module partition detected using the spontaneous network alone. Nodes with gray colors have module assignments that cannot be easily mapped to one of the nine modules. (F) Similarity (z-score of the Rand index) of stimulus-evoked and spontaneous modular structure as a function of the interlayer coupling parameter, ω. When ω is small, detected modules reflect specific stimuli; when ω is larger, detected modules are more similar to spontaneous modular structure. (G) Node-level flexibility grouped according to modules. Note: high levels of heterogeneity across modules. (H) Node-level flexibility plotted in anatomical space. (I) Correlation of stimulus-evoked flexibility and participation coefficient estimated from spontaneous network data alone (J) Variation of flexibility patterns as the number of detected modules changes.

