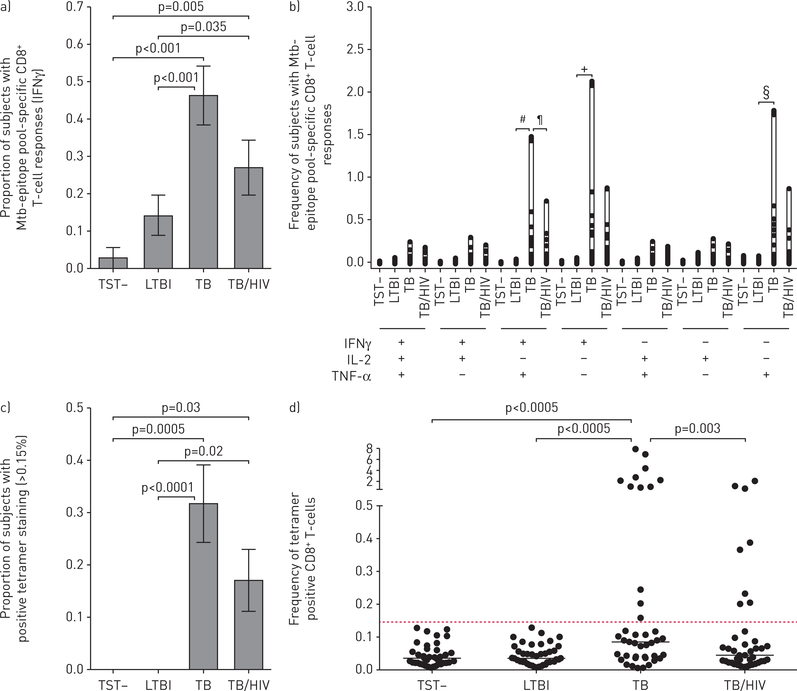
FIGURE 1.
CD8+ T-cell cytokine and tetramer responses to Mycobacterium tuberculosis (Mtb)-epitope pool distinguishes latent tuberculosis infection (LTBI) from tuberculosis (TB). a) The proportion of subjects with detectable CD8+ T-cell responses to a pool of eight Mtb-specific epitopes, as measured by interferon (IFN)-γ production in an intracellular cytokine staining (ICS) assay is shown (error bars indicate SEM). A positive response is defined as having at least 0.05% of CD8+ T-cells expressing IFN-γ after subtraction of background (no stimulation) responses. The proportion of positive responses between groups were compared using Chi-squared tests. b) The frequency of Mtb-specific CD8+ T-cells based on their production of either IFN-γ, tumour necrosis factor (TNF)-α and/or interleukin (IL)-2 is shown. The combinations of different cytokine functions are shown on the x-axis, with the frequency of distinct cytokine-producing cells within the Mtb-epitope pool responsive CD8+ T-cell compartment on the y-axis. The frequency of Mtb-specific CD8+ T-cells productive of each cytokine were compared using Kruskal–Wallis test, following adjustment for multiple comparisons using the Dwass, Steel, and Critchlow-Fligner method. c) The proportion of subjects with detectable CD8+ T-cell binding to a pool of eight Mtb-specific tetramers, as measured by flow cytometry, is shown (error bars indicate SEM). A positive response is defined as having at least 0.15% of CD8+ T-cells staining positive for tetramer. Statistical analysis with Chi-squared followed by pairwise comparison (Bonferroni adjustment). d) The frequencies of CD8+tetramer+ T-cells in different cohorts are shown. Statistical analysis with Kruskal–Wallis test followed by pairwise comparison (Bonferroni adjustment). Statistical Analysis System v9.4 (SAS Institute Inc., Cary, NC, USA) was used for analysis. #: p=0.02; ¶: p=0.0009; +: p=0.012; §: p=0.006.

