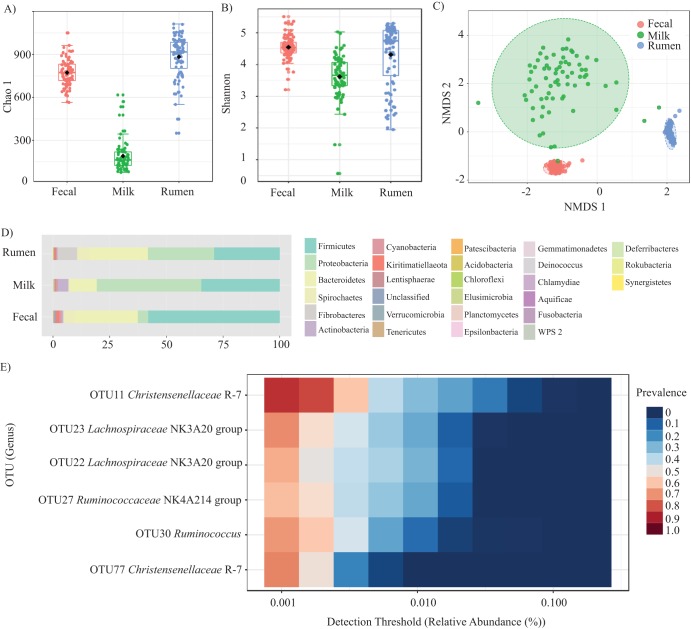
FIG 1.
Bovine microbiota. (A) The alpha-diversity metrics indicate that the species richness is higher in the rumen and fecal samples than in raw milk based on the Chao1 index. (B) Shannon’s index of diversity was also calculated and indicated that overall diversity varied between the niches. (C) NMDS ordination illustrated the significant dissimilarity that was observed between communities in each of the niches (NMDS stress = 0.06). In addition, the variances observed in the milk microbiota were significantly higher than the variances observed in either the fecal or rumen samples. (D) A stacked bar graph illustrates the relative abundance of each phyla present in rumen, fecal, and milk samples averaged across all samples analyzed for each sample type and indicates that the presence of each of the major taxa (Firmicutes, Proteobacteria, and Bacteroidetes) in each niche. (E) A heat map displaying the detection threshold and prevalence across niches for OTUs that occurred in >60% of all samples (milk, feces, and rumen).

