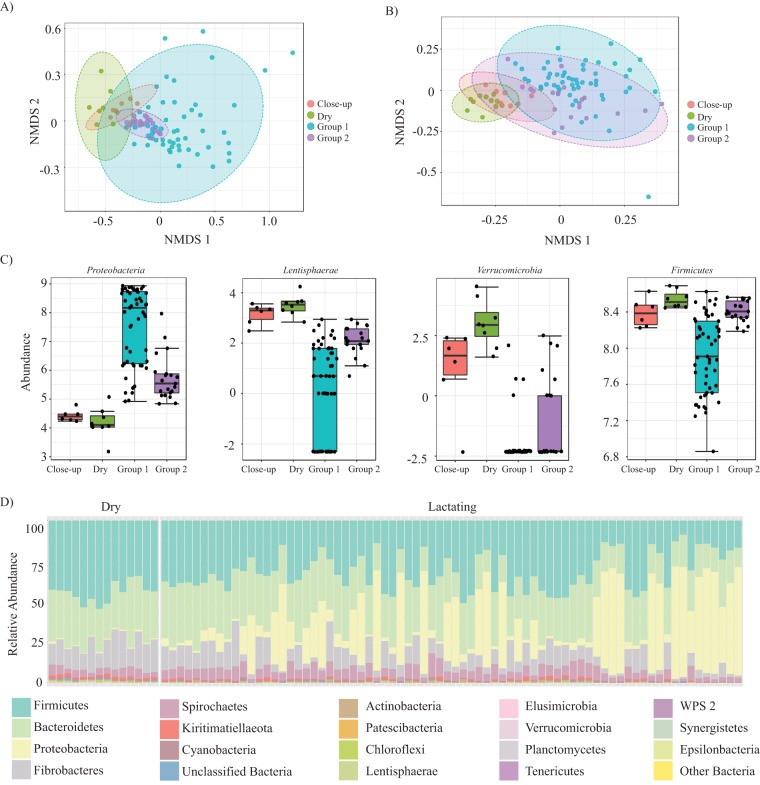
FIG 2.
Variance in the bovine microbiome based on diet and physiological stages. (A and B) NMDS ordination is used to illustrate dissimilarity of rumen samples based on the diet fed to each animal (NMDS stress = 0.09) (A). The rumen showed a dissimilarity based on the diet that was greater than the dissimilarity that was observed in fecal samples (NMDS stress = 0.16) based on diet (B), or milk samples where no dissimilarity was observed (not shown). (C) Log-transformed counts of the statistically significant phyla that were responsible for the dissimilarity based on feed group were Proteobacteria, Lentisphaerae, Verrucomicrobia, and Firmicutes. (D) A stacked bar plot illustrates that lactating animals had a significantly higher abundance of Proteobacteria in their rumens than their dry counterparts.

