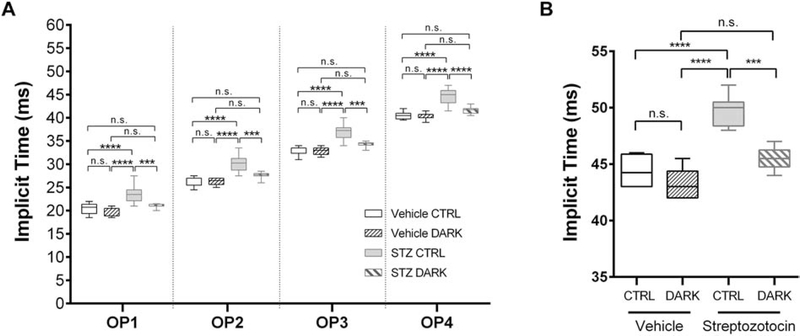
Figure 5:
Electroretinographic responses of light-deprived mice with type 1 diabetes. Data are represented as median (line), IQR (box), and range (whiskers); n=>8 mice/group. A, Implicit times of the scotopic OPs recorded from a 0.983 cd·s/m2 flash in 6-month-old mice with type 1 diabetes (treated with STZ at 2 months) or healthy controls (vehicle-injected), and either deprived of light for 2 months starting at age 4 months (DARK) or kept in standard lighting conditions (CTRL). *** = P<0.001, **** = P<0.0001, by 2-way RM ANOVA with Bonferroni post-hoc correction. B. Implicit time of the b-wave responses to 6 Hz flicker stimulation. *** = P<0.001, **** = P<0.0001, by 1-way ANOVA with Bonferroni post-hoc correction.

