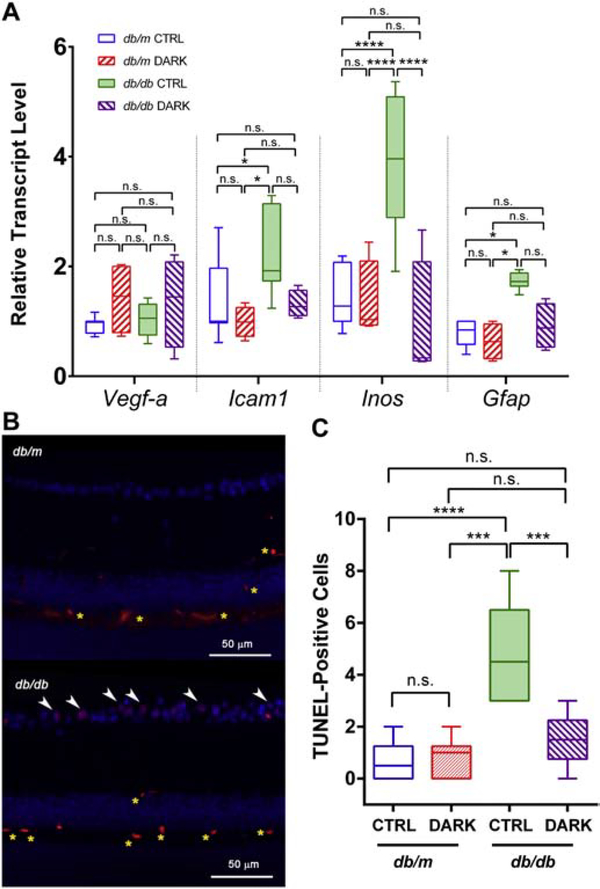
Figure 6:
Reactive gene expression profile and cell death in mice with type 2 diabetes deprived of light. Box plots show median (line), IQR (box), and range (whiskers); n=>5 mice/group; db/db = type 2 diabetes group, db/m = age-matched healthy control group; DARK = mice deprived of light beginning at age 3 months until age 6 months, CTRL = mice kept in standard lighting conditions. A, Transcripts for the targets indicated on the x-axis were amplified by quantitative PCR. Threshold counts were transformed into copy number, normalized to the mean of control sequences for rpl32 and gapdh and then represented as fraction of the value of the “db/m CTRL” group. ** = P<0.01, **** = P<0.0001 by 2-way ANOVA with Bonferroni post-hoc correction. B, Representative fluorescence micrographs showing TUNEL-staining (red) and DAPI (blue), with apoptotic (double-stained) nuclei in the ganglion cell layer indicated by white arrowheads. Non-specific staining is detected in the intermediate and deep capillary plexuses (yellow asterisks). C, Quantification of apoptotic nuclei (TUNEL and DAPI double-positive signals) per length of cross-sectional retina.

