Figure 8:
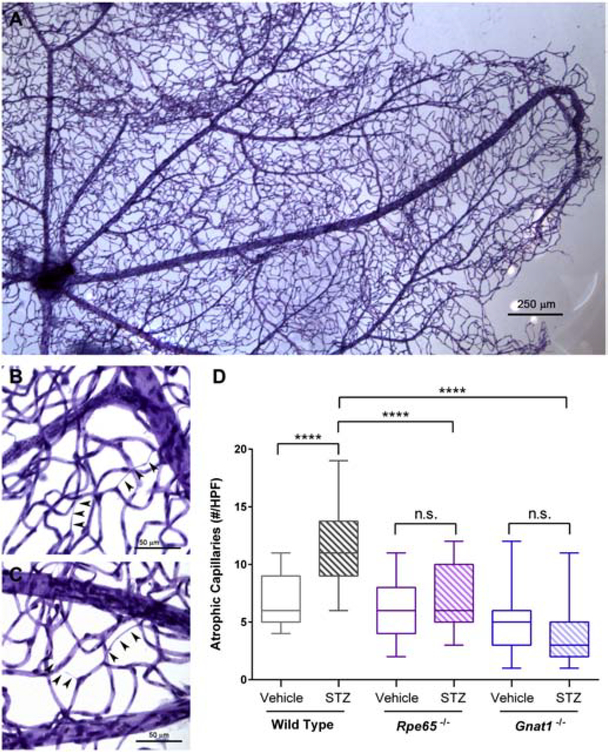
Diabetes-associated retinal vascular changes in mice with disrupted rod phototransduction. A, Representative photomicrograph of retinal vascular tree isolated from STZ-treated wild type mice by trypsin digest of neuroglial elements followed by PAS and hematoxylin staining. B and C, Representative high-power micrographs showing atrophic capillaries in STZ-treated wild type mice, denoted by arrowheads. Each series of three arrowheads was scored as one individual atrophic capillary. D, Quantification of capillary lesions in STZ-treated mice. Data are represented as median (line), IQR (box), and range (whiskers); n=>3 mice/group. **** = P<0.0001 by 2-way ANOVA with Bonferroni post-hoc correction.

