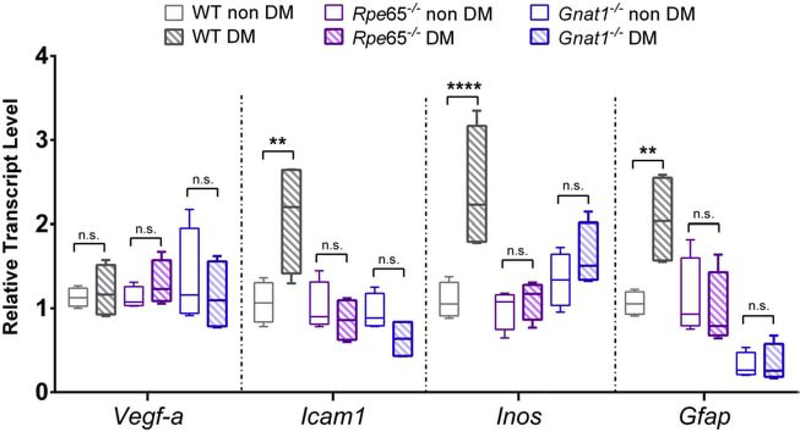
Figure 9:
Diabetes-induced reactive gene expression profile in mice with disrupted rod phototransduction. Total RNA was isolated from retinas of 6-month-old mice of the indicated genotypes, after STZ-induced diabetes (DM) or vehicle-injection (non DM). Transcripts for the targets indicated on the x-axis were amplified by quantitative PCR. Threshold counts were transformed into copy number, normalized to the mean of control sequences for rpl32 and gapdh and then represented as a fraction of the value of the “WT non DM” group. Box plots show median (line), IQR (box), and range (whiskers); n=>5 mice/group. ** = P<0.01, **** = P<0.0001 by 2-way ANOVA with Bonferroni post-hoc correction.

