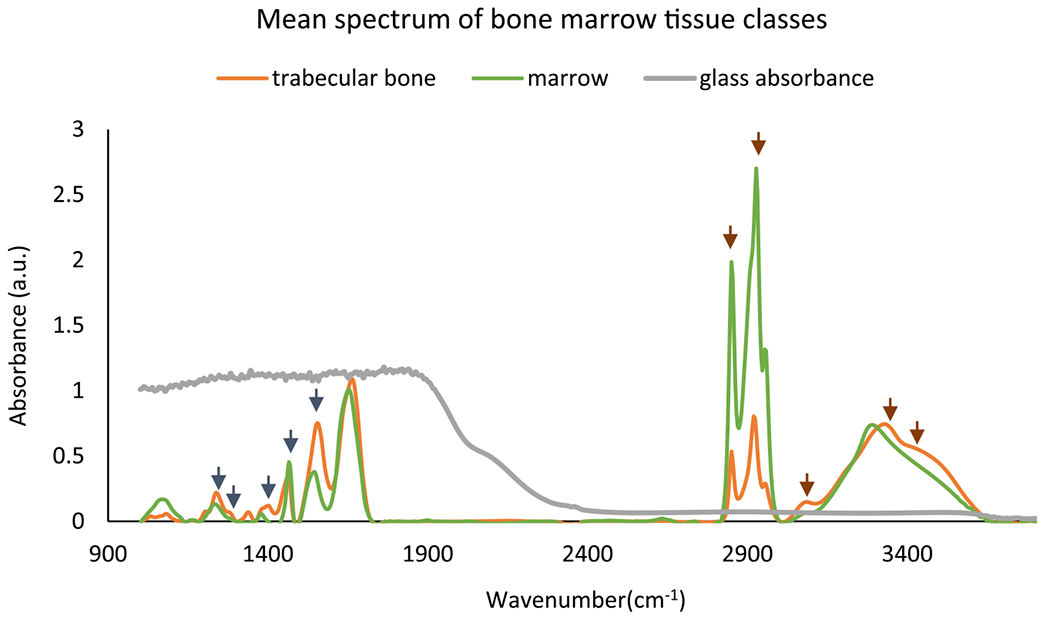
Figure 3.

Mean spectra for two classes: trabecular bone and marrow (everything other than trabecular bone in BM) from paraffin-embedded bone marrow tissue microarrays. Optimal features selected by GA-LDA29 for classification of trabecular bone and stroma are shown with short arrows in both fingerprint region (dark blue arrows) and glass transmission window (brown color). The glass absorbance spectrum indicates that histology glass slides are not suitable for imaging in the fingerprint region but can be used for imaging in the higher wavenumber region.
