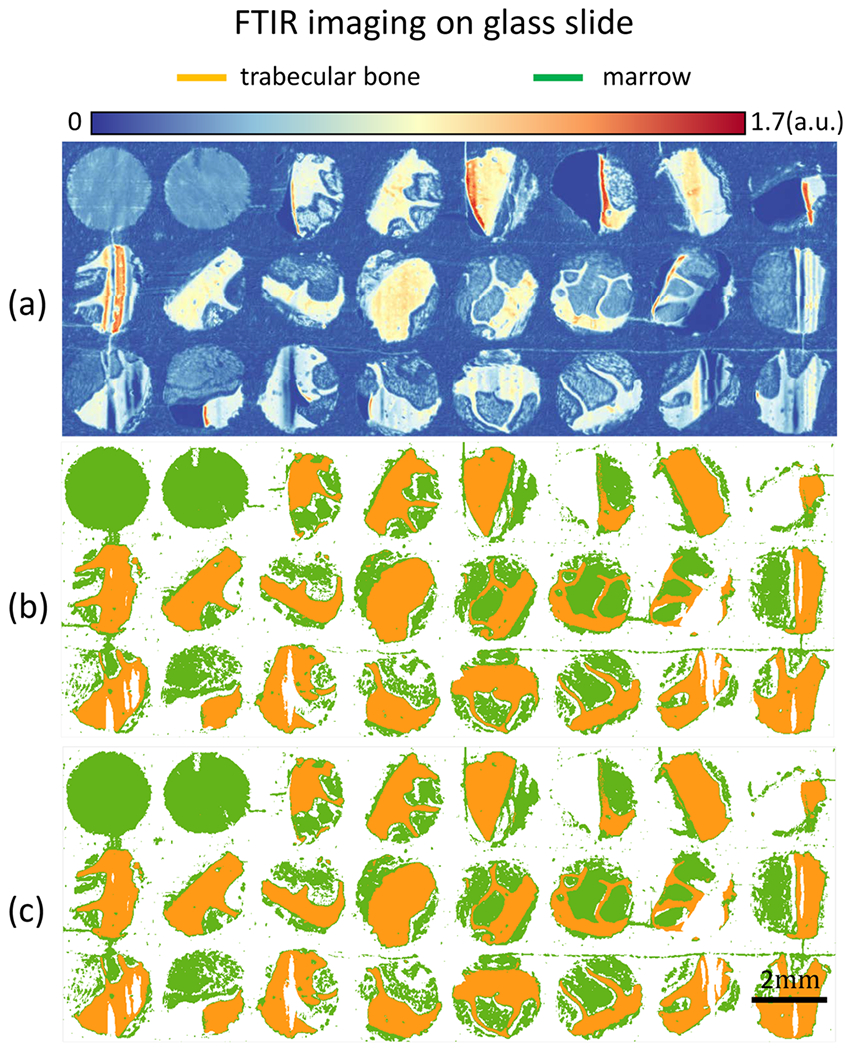
Figure 5.

TMAs of bone marrow tissue cores are imaged with FT-IR glass slides. (a) FT-IR band image at 3300 cm−1. (b) Classification results for trabecular bone and marrow (everything in BM other than trabecular bone) using all 76 spectral features in glass transmission region. (c) Classification results using the 5 optimal features selected using the GA-LDA algorithm.29
