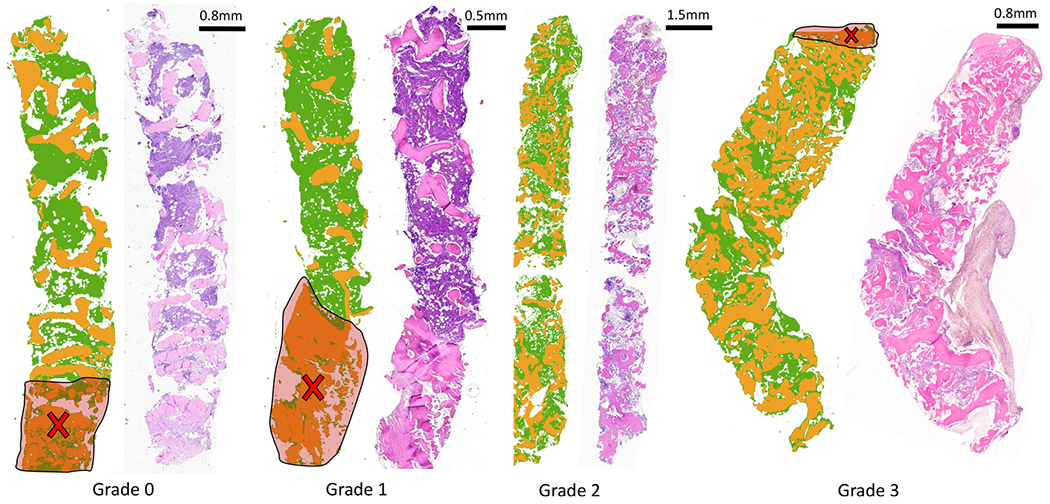
Figure 7.

Classification result from the proposed imaging method, visually compared with traditional H&E stain. Trabecular bone area measurement is applied on clinical samples of bone marrow biopsy from each osteosclerosis grade (0–3). Results of classification (trabecular bone in orange and stroma in green) of FT-IR imaged data for each grade section and corresponding H&E stained adjacent tissue section from the same tissue block (right) are shown. Increase in trabecular bone area from grade 0 to grade 3 can be easily quantified using digitally classified images shown in the middle for each section. Cross-marks shown on the images indicate crushing artifacts on the tissue that are ignored while grading tissue sections.
