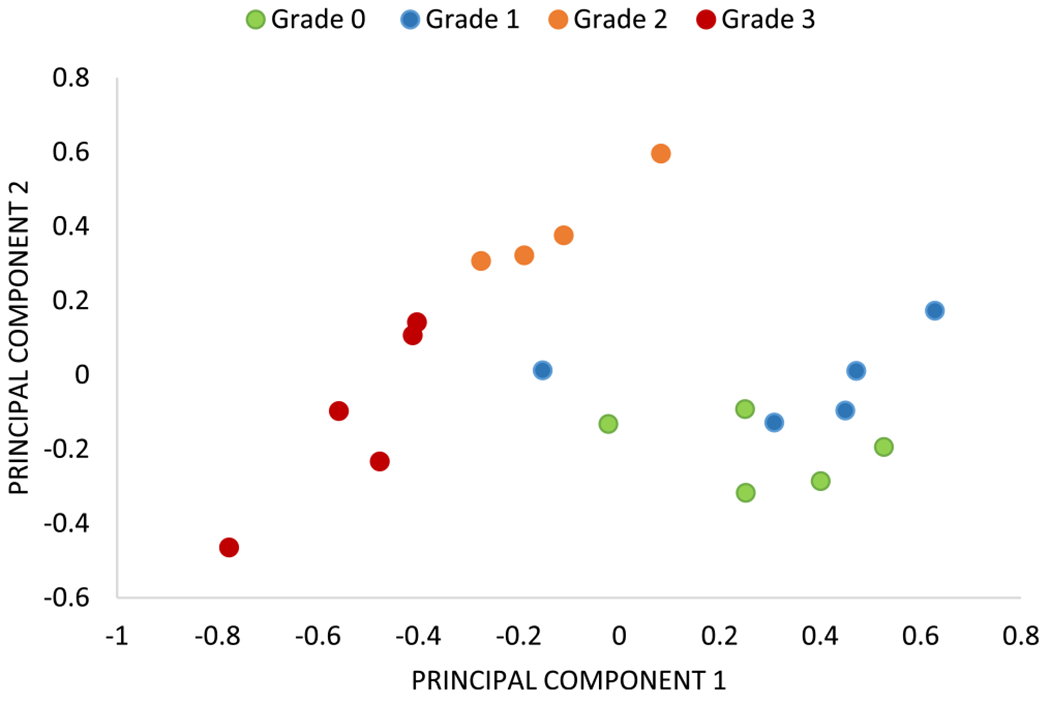
Figure 9.

Scatter plot using the first two principal component scores (with variance explained 63.20% and 34.44%). Feature extraction from the proposed three metrics (TBA, AS, and N) gives clear separation among samples of each grade with the exception of a few samples from grades 0 and 1.
