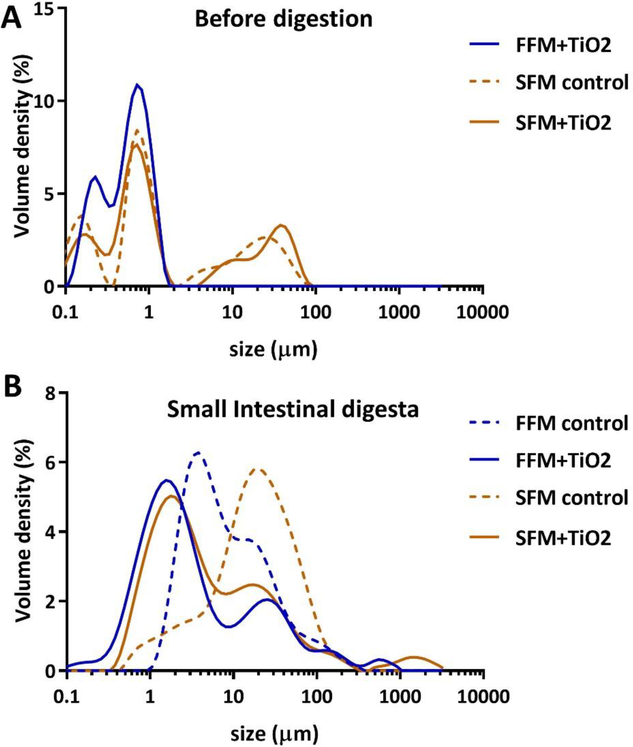
Figure 2.
Size distributions of particles before digestion and in small intestinal phase digesta. (A) Volume density (%) of particle diameter distributions for TiO2 in FFM (fasting food model, phosphate buffer), SFM (standardized food model) control, and TiO2 in SFM. (B) Volume density (%) of particle diameter distributions for small intestinal phase digesta of FFM control, TiO2 in FFM, SFM control, and TiO2 in SFM.

