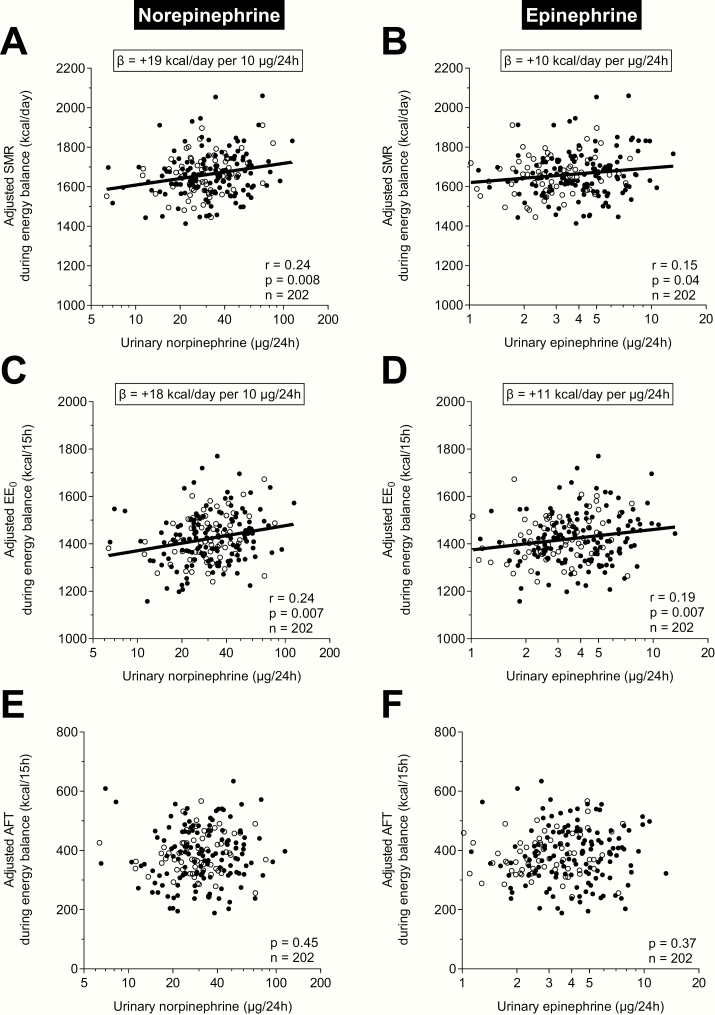
Figure 3.
Associations between 24-hour urinary norepinephrine and epinephrine excretion rates and components of 24-hour energy expenditure (24EE) during energy balance. Associations between urinary (A), norepinephrine and (B), epinephrine excretion rates and adjusted sleeping metabolic rate (SMR). On average, a greater urinary norepinephrine excretion rate by 10 μg/24h and a greater urinary epinephrine excretion rate by 1 μg/24h were associated with a greater adjusted SMR by 19 kcal/d (CI: 9-29 kcal/d) and 10 kcal/day (CI: 2-19 kcal/d), respectively. Associations between urinary (C), norepinephrine and (D), epinephrine excretion rates and adjusted energy expenditure in the inactive, awake state (EE0). On average, a greater urinary norepinephrine excretion rate by 10 μg/24h and a greater urinary epinephrine excretion rate by 1 μg/24h were associated with a greater adjusted EE0 by 18 kcal/d (CI: 8-27 kcal/d) and 11 kcal/d (CI: 3-20 kcal/day), respectively. Lack of associations between urinary (E), norepinephrine and (F), epinephrine excretion rates and adjusted awake-fed thermogenesis (AFT). All adjusted EE measures (SMR, EE0, and AFT) were calculated via linear regression analysis including fat-free mass (FFM), fat mass (FM), age, sex, ethnicity, calorimeter temperature, and calorimeter room as covariates after adding the respective average value calculated in the whole cohort to the residual values obtained from the respective regression model. X-axes are formatted on a logarithmic scale (log10) to account for the skewed data distribution of raw catecholamine values. Black circles denote male, white circles denote female participants.

