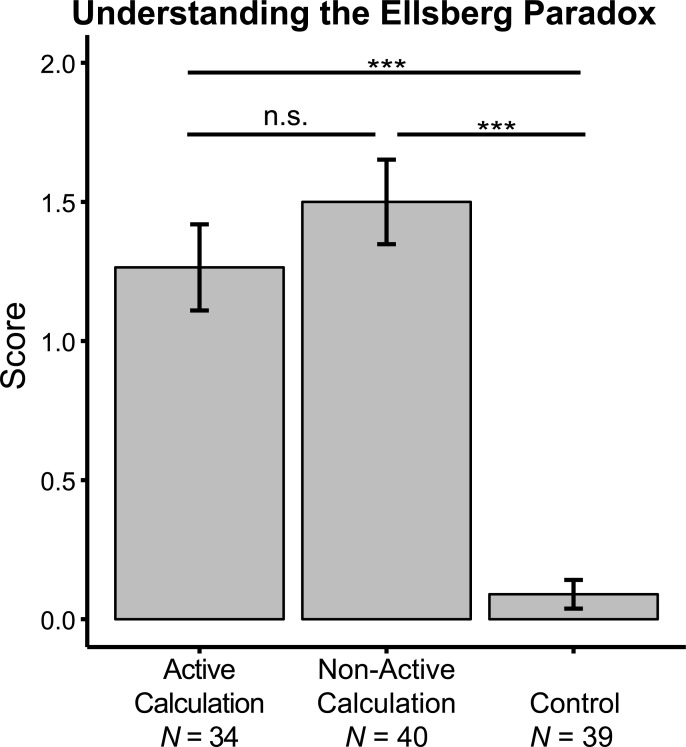
Fig 2. Participants understood the Ellsberg Paradox after AC and NC interventions.
Mean and standard deviation of scores of understanding the Ellsberg Paradox, separately for participants from the three groups: Active Calculation, Non-active Calculation, and control. After participants finished the decision making task, they were asked to provide a written explanation of the Ellsberg Paradox. The response was scored on a 0–3 scale based on three scoring standards: whether participants mentioned (1) the difference between ambiguity and risk; (2) that they had an equal chance of winning in the reference and the ambiguous lottery; and (3) the need to select higher value rewards. Error bar represents standard error. Post-hoc p values were adjusted by FDR procedure, and are labeled as: n.s., non-significant, ***, p < 0.001.

