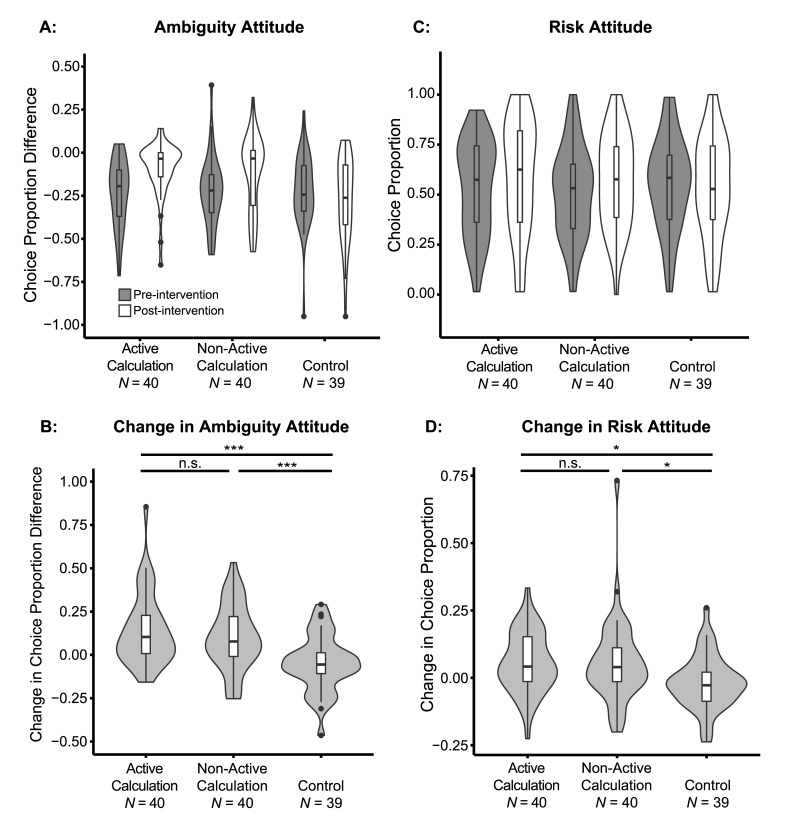
Fig 4. Changes in ambiguity and risk attitudes following the intervention.
Violin and box plots of: (A) Ambiguity attitude, calculated as the difference between the choice proportion of ambiguous lotteries and the modeled choice proportion of 50% risky lotteries, before and after intervention for each group: Active Calculation, Non-active Calculation, and control. (B) Change in ambiguity attitude after intervention for each group. Positive number indicated increase in choice proportion, in other words, decrease of ambiguity aversion. (C) Risk attitude, calculated as the choice proportion of risky lotteries, before and after intervention for each group. (D) Change in risk attitude after intervention for each group. Positive numbers indicate increase in choice proportion (decrease of risk aversion). P values were adjusted by FDR procedures, and significance levels are labeled as: n.s., non-significant, *, p < 0.05, **, p < 0.01, ***, p < 0.001. Plots are trimmed within the range of the data. Box plots show the medians with horizontal thick lines. The lower and upper hinges correspond to the first and third quartiles, and the whiskers extend from the hinge to the largest value no further than 1.5 inter-qualitle range (distance between the first and third quartiles) of the data. Outliers beyond the whiskers are plotted by dots individually. Violin plots show the mirrored densities of the data.

