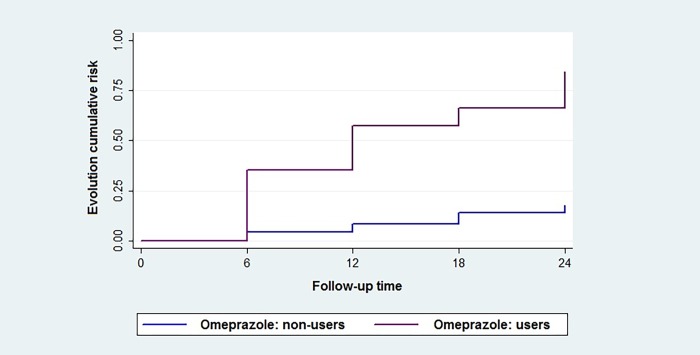
Fig 1. Kaplan-Meier estimates for CKD progression among omeprazole users and non-users.
Fig 1 shows the Kaplan-Meier survival plot for the occurrence of CKD evolution to worse stages in omeprazole users and non-users. The follow-up time is shown in the X axis and the cumulative risk of CKD evolution in the Y axis.

