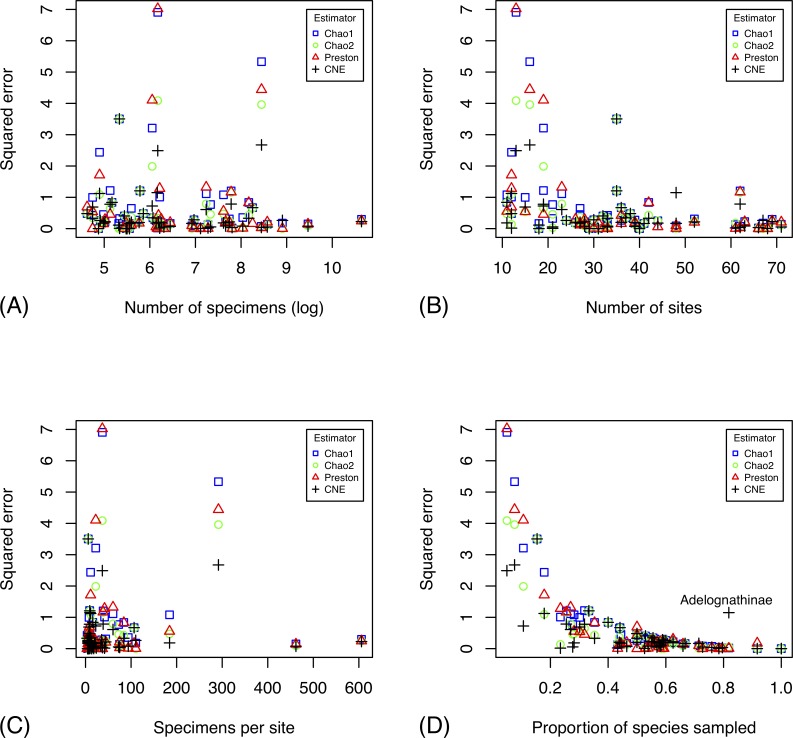
Fig 3. Accuracy of different estimators in predicting the species richness of well-studied groups, and the species pool known in 2003 of more poorly studied groups.
The plots show the accuracy (measured as squared error of log estimates) of the species richness estimates as a function of the number of specimens (A), the number of sites (B), the number of specimens per site (C), and the fraction of the species pool sampled (D). The CNE outlier in (D) is Ichneumonidae: Adelognathinae, one of the groups with the smallest number of specimens per site.

