
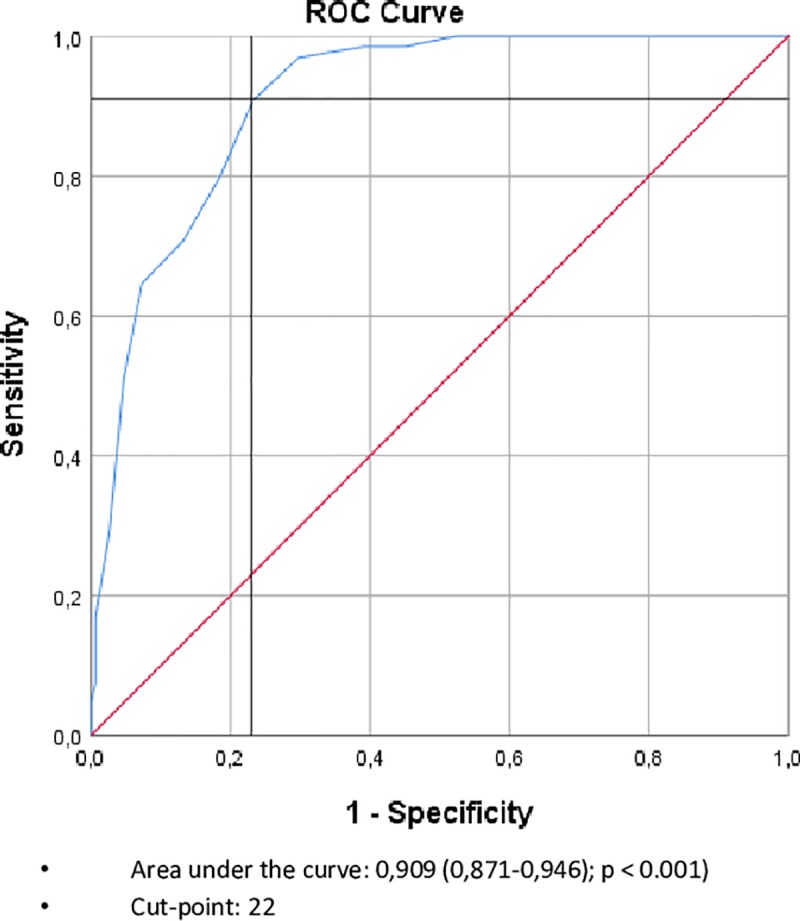
Fig 2. ROC curve for the MNA-LF using dichotomized MNA-SF (normal nutritional status versus at risk/malnourished) as referent.
Official websites use .gov
A
.gov website belongs to an official
government organization in the United States.
Secure .gov websites use HTTPS
A lock (
) or https:// means you've safely
connected to the .gov website. Share sensitive
information only on official, secure websites.