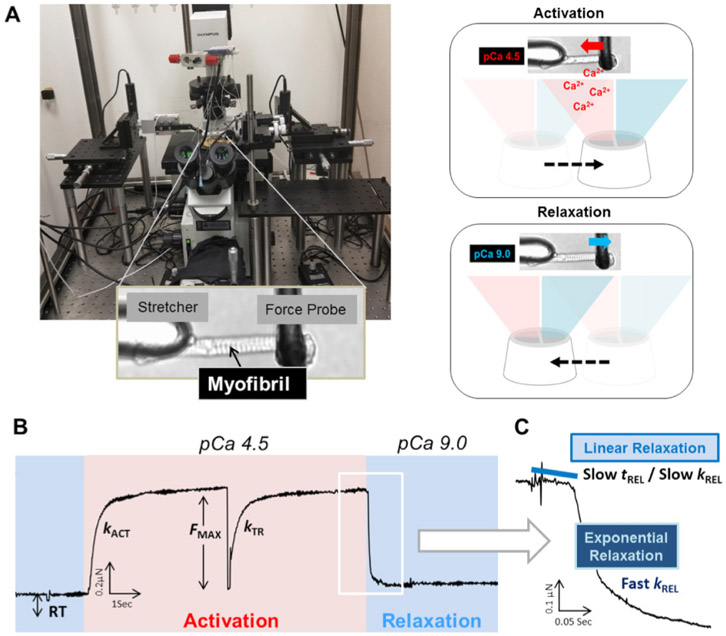
Figure 3.
Myofibril mechanics rig and representative activation-relaxation cycle. (A) Left: Myofibril mechanical rig set-up. Right: Scheme illustration of double barrel perfusion pipette delivering different concentrations of calcium (pCa 4.5 and pCa 9.0). Myofibrils are mounted between a force probe (calibrated to detect force in μN/μm) and a supporting stretcher. (B) Recording chart of one myofibril activation. Resting Tension (RT), force generation (FMAX), and activation kinetics (kACT and kTR) were measured. Relaxation is highlighted with the white box. (C) Representative trace of myofibril relaxation showing linear and exponential phases of relaxation.

