
Fig 7. GPP and Re ratios.
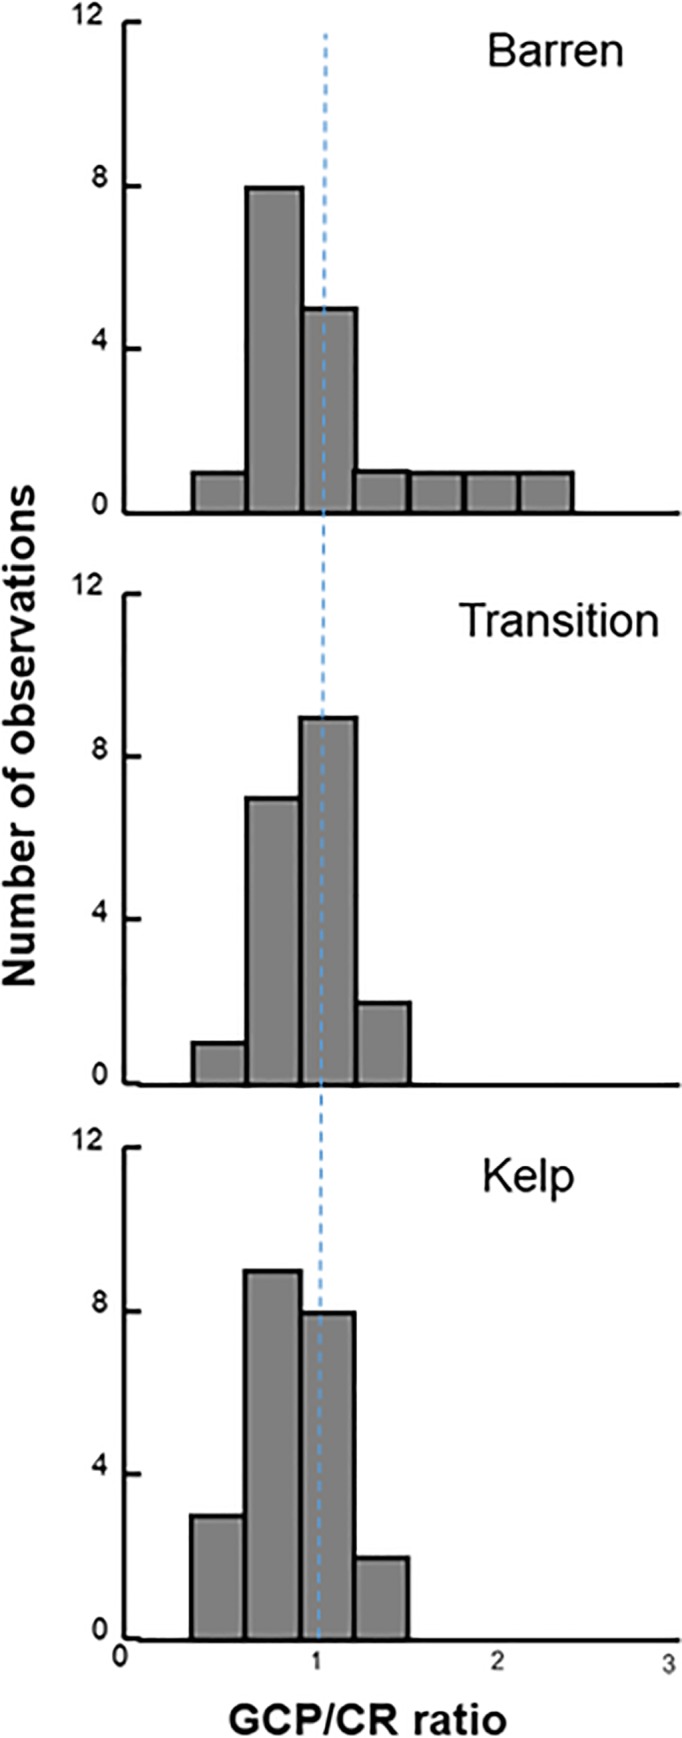
Frequency distribution of GPP / Re ratios within each habitat type across all nine islands where cBITs were deployed in 2016 and 2017 (Table 1). Each data point represents measurements from a single cBIT. Note the urchin barrens have the highest ratios observed, and the kelp forests have the largest number of low values. The vertical dashed line represents the 1:1 ratio.