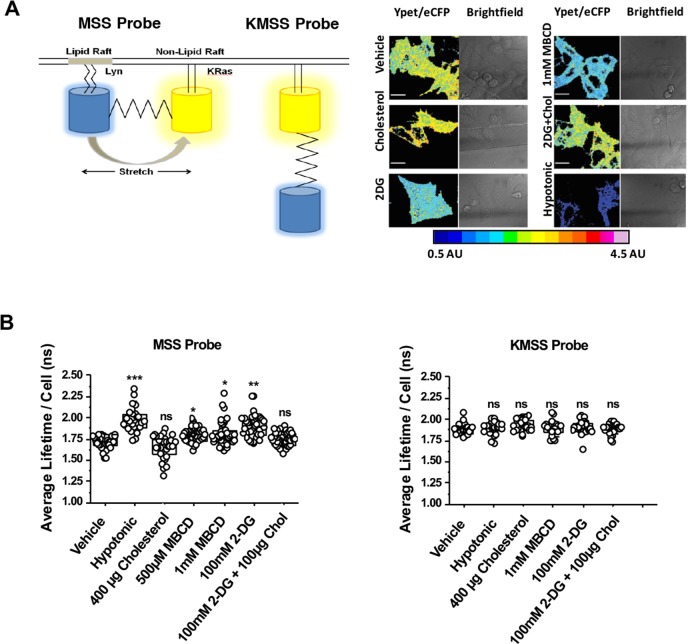
Fig 6. Acute treatment of TZM-bl cells with 2-DG increases plasma membrane tension.
A.) (Left) Cartoon diagram model depicting membrane tension FRET probe MSS and its control probe (insensitive to membrane tension), KMSS. (Right) Representative pseudocoloured FRET efficiency (i.e. Ypet/eCFP) images of TZM-bl cells expressing MSS under listed treatment conditions; scale bar 10μm. B.) (Left) Dot plots depicting donor CFP lifetimes of the tension-sensitive MSS probes extracted from single cells in the treatment conditions listed (n = at least 20/condition, collected during the course of three independent experiments; *p<0.5, **p<0.01 *** p<0.001 as determined by either one-way ANOVA). (Right) Dot plots depicting donor CFP lifetimes of the tension-insensitive KMSS probes extracted from single cells in the treatment conditions listed (n = at least 30/condition, collected during the course of three independent experiments; *p<0.5, **p<0.01 *** p<0.001 as determined by either one-way ANOVA).

