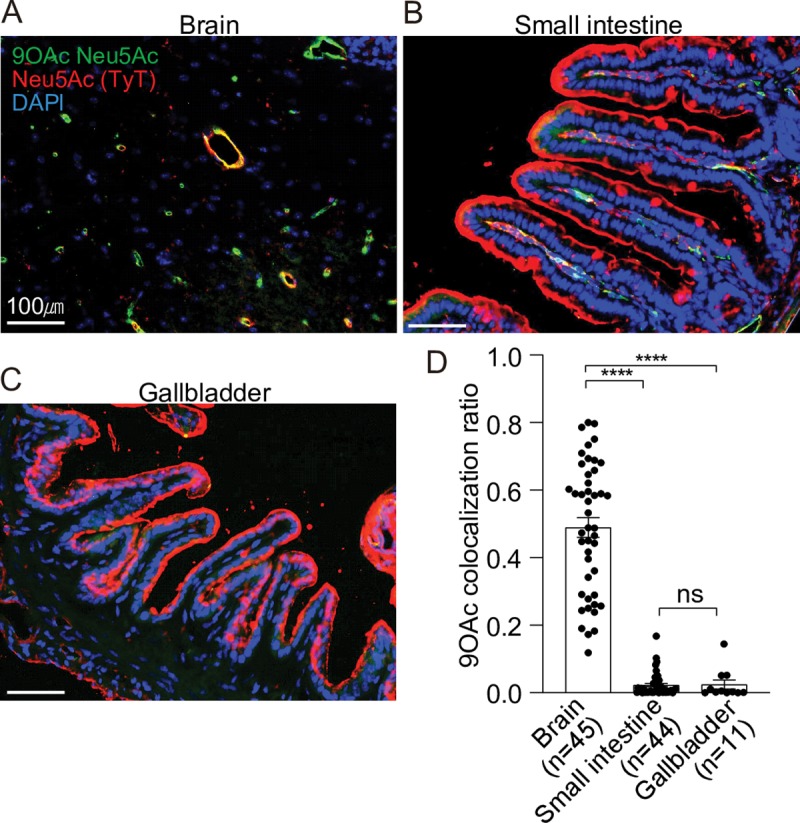
Fig 2. CMAH null mouse tissues and cells relevant to typhoid toxin-mediated clinical signs express both unmodified and 9-O-acetylated glycan receptor moieties.

A-C, Staining of Cmah null mouse brain (A), small intestine (B), and gallbladder (C) tissue sections. PToV-P4 HE-Fc (+ 2nd Ab conjugated to AF488) and typhoid toxin (TyT)-AF555 were used to detect 9-O-acetylated Neu5Ac (green) and Neu5Ac (red), respectively. DAPI was used to stain DNA (blue). Scale bar, 100 μm. Representative images used for co-localization quantification are shown. D, Co-localization frequency of cells that are positive for both TyT (for both unmodified and modified Neu5Ac) and PToV-P4 HE (9-O-Ac Neu5Ac). Y-axis values are the fraction of red signal overlapping green signal. Three independent experiments were performed. Bars represent average ± standard error of the mean. **** p<0.0001. n = 11–45, as indicated in the graph. Two-tailed unpaired t-tests.
