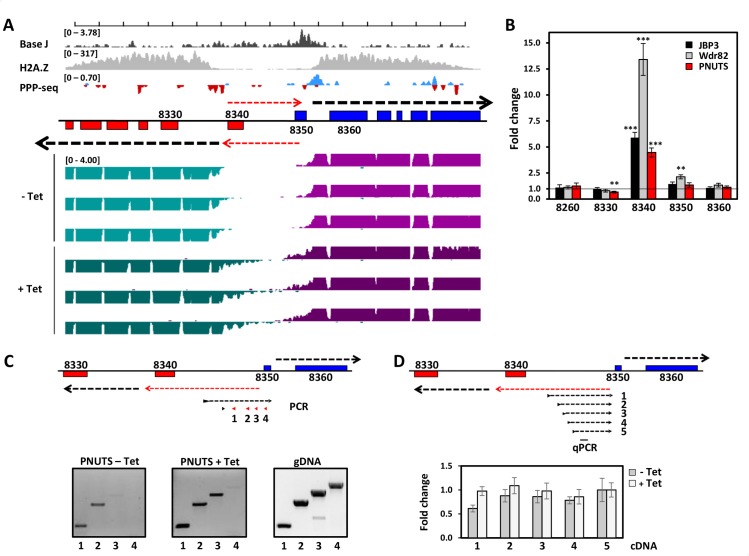
Fig 5. TbPNUTS affects early termination of antisense transcription at TSSs.
(A) Representative region of chromosome 10 illustrating bi-directional transcription at TSSs upon TbPNUTS ablation. TSSs are denoted by PPP-seq and H2A.Z ChIP-seq enrichment in wild-type T. brucei. PPP-seq track colors: Red, reverse strand coverage; blue, forward strand coverage. RNA-seq track colors: Green, reverse strand coverage; Purple, forward strand coverage. Black arrows indicate direction of sense transcription. Red arrows indicate stimulated antisense transcription in the PNUTS mutant that leads to de-repression of the annotated 8340 gene on the bottom strand and, to a lesser degree, the 8350 gene on the top strand. (B) Confirmation of mRNA-seq transcript changes in the PNUTS, Wdr82 and JBP3 RNAi by RT-qPCR. RT-qPCR analysis was performed for the indicated genes as described in Material and Methods. Transcripts were normalized against Asf1 mRNA, and are plotted as the average and standard deviation of three replicates. P values were calculated using Student’s t test. **, p value ≤ 0.01; ***, p value ≤ 0.001. RT-PCR products for gene 8340 were confirmed by cloning and sequencing of multiple clones. (C) Mapping of the 5’ end of the antisense transcript by nested RT-PCR on strand-specific cDNA. PCR utilized constant 3’ primer (indicated by black arrow-head) with varying 5’ primers indicated in red (primers 1–4). cDNA levels utilized in the PCR reactions were normalized against strand-specific Asf1 mRNA. (D) Strand-specific RT-qPCR analysis of antisense nascent transcript. cDNA was generated using various strand specific 3’ primers and RNA from–and + Tet. qPCR was then done using internal primers to amplify the region indicated by black bar. Transcript levels were normalized against strand-specific Asf1 mRNA. Error bars indicate standard deviation from at least three experiments.

