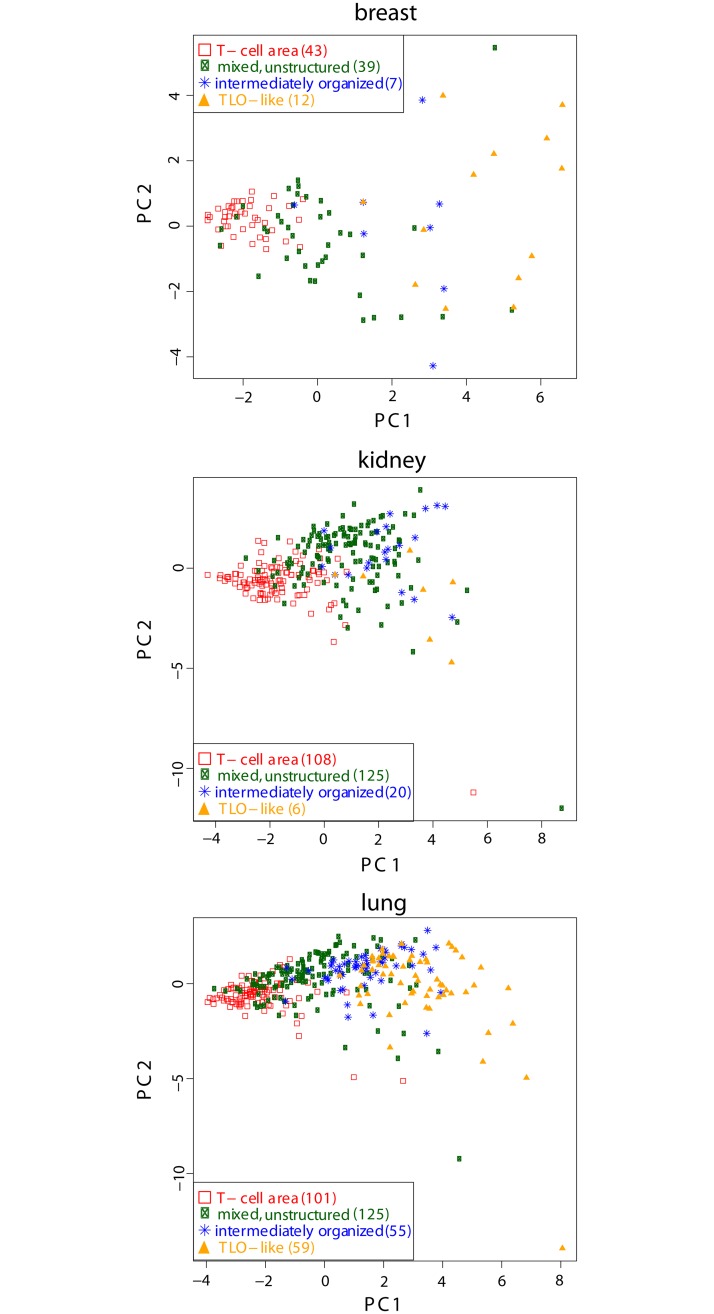
Fig 4. Principal component analysis between components with highest variance (PC1, PC2) for 700 samples in total (number of each class and tissue type listed in legend as brackets) that were visually classified by a pathologist.
The number of nodes (|V|, VB|/|V|), edges (|E|, ), TLO-like organization (κ(2), κ(5)), homogeneity (H), clustering coefficient (C), average degree (〈K〉), and the average Euclidean distance between all nodes are used as features, see Section Features of infiltrates.

