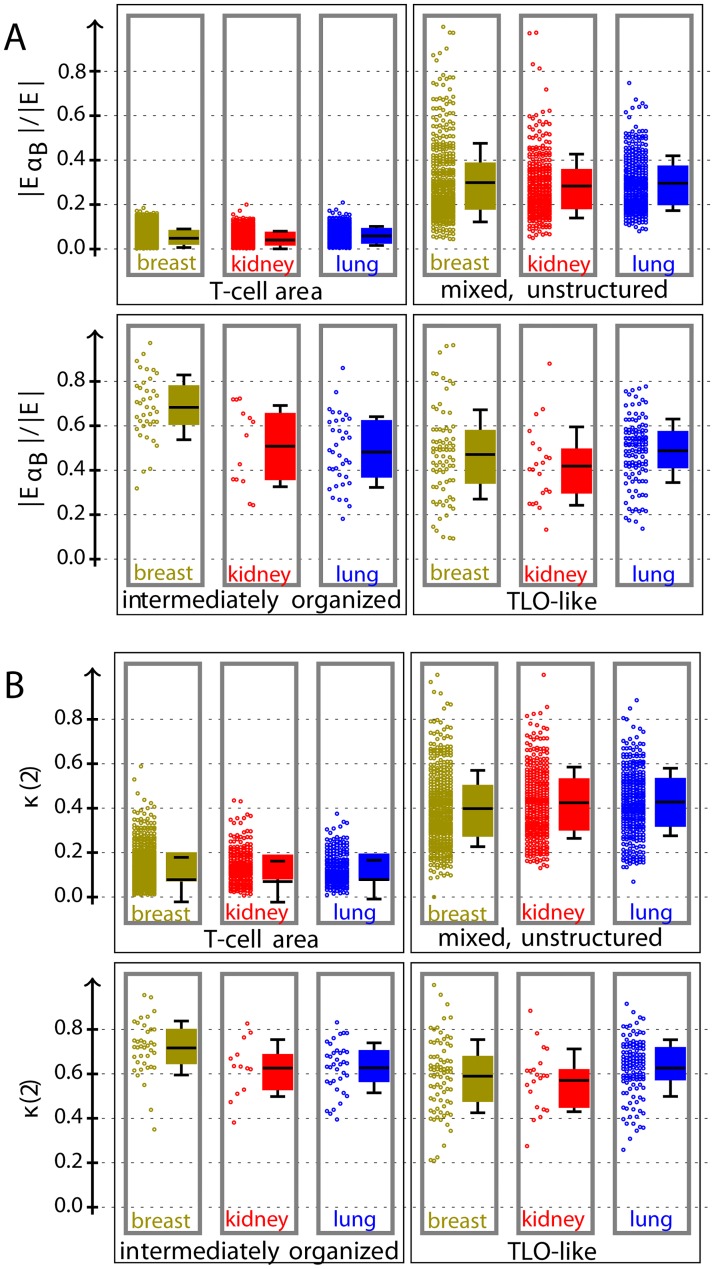
Fig 6. Distribution of relative number of edges between B-cells (A) and organization (B): Gray border represents significant difference between corresponding class and all remaining classes of same tissue type by Mann–Whitney U test using a significance level of 0.001.
Each distribution is displayed as raw data (left) and a box plot (right) with mean (line), quartiles (color box), and standard deviation. The TLO-like organization κ measures the number of edges between T- and B-cells that are connected to a B-cell cluster, see Eq (1).

