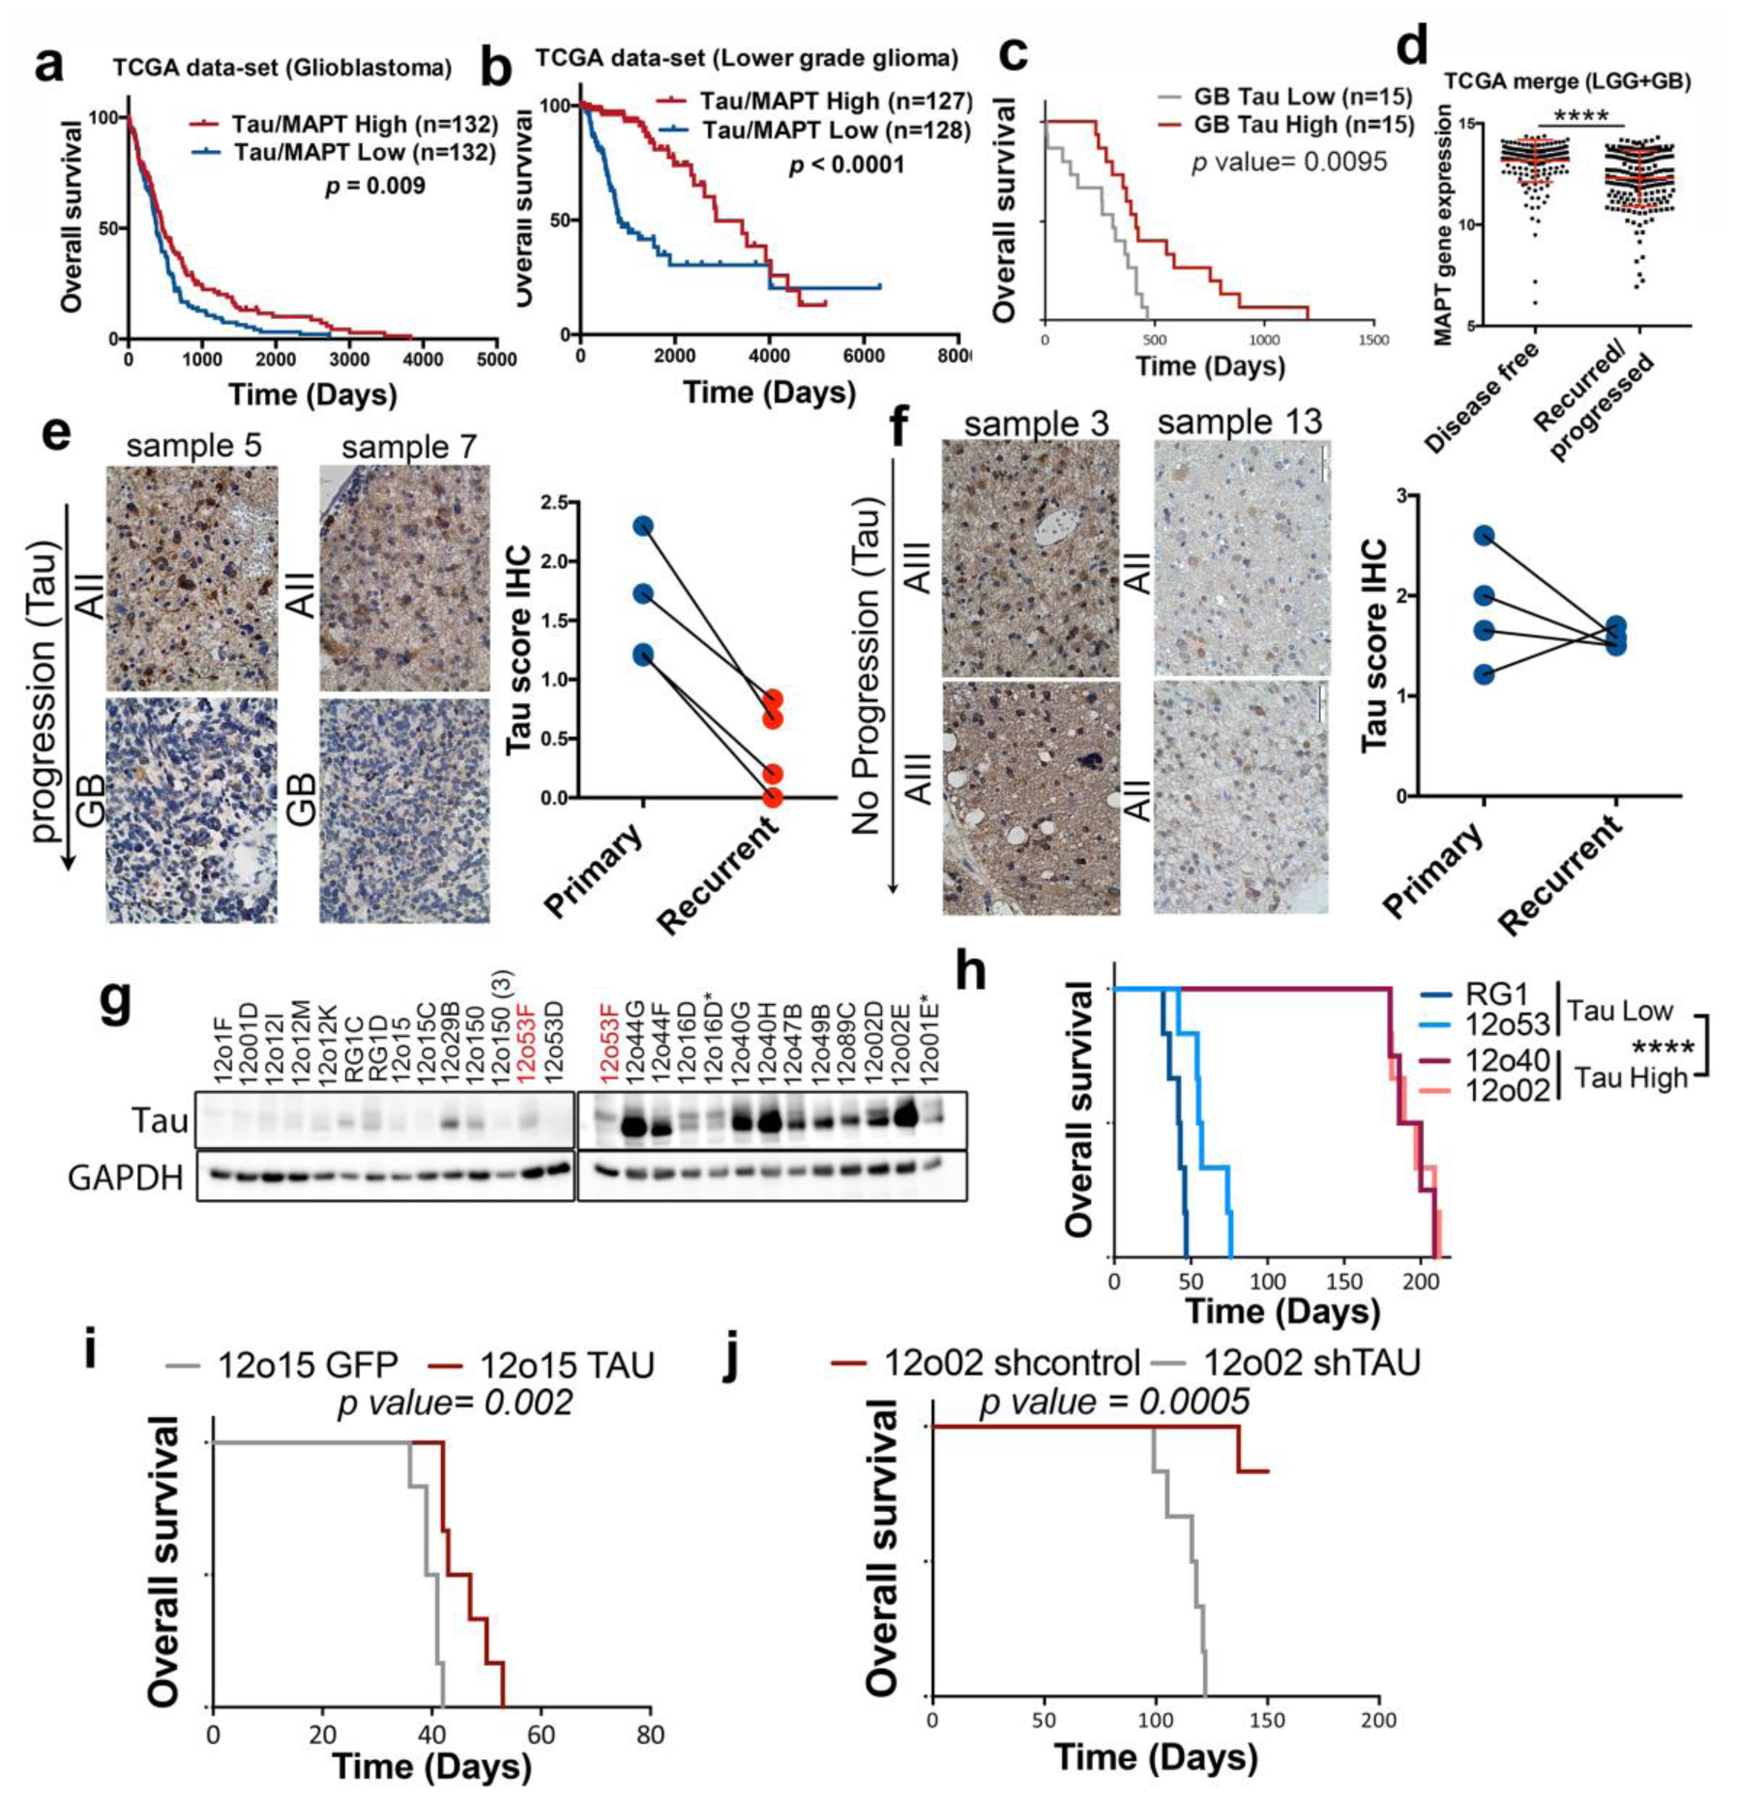
Figure 2: The expression of Tau in gliomas correlates inversely with tumor aggressiveness.

a,b, Kaplan-Meier overall survival curves of patients from the TCGA, the GB cohort (n=264) (A) or the LGG cohort (n= 155). Patients in each cohort were stratified into 2 groups based on high and low Tau (MAPT) expression values. c, Kaplan-Meier overall survival curves of patients from our own GB cohort (n=30). Patients in each cohort were stratified into 2 groups based on high and low Tau (MAPT) expression values (measured by RT-PCR using HPRT levels for normalization). d, Analysis of Tau (MAPT) mRNA expression by RNAseq in gliomas (TCGA cohort) grouped according to the clinical evolution of the tumors (n=386). e,f, Representative pictures of the IHC Tau staining of paired glioma samples (primary and recurrent tumor). Average Tau IHC score of the paired samples in shown on the right. g, WB analysis of Tau expression in tumor tissue extracts from subcutaneous patient-derived xenografts (PDXs). GAPDH was used as a loading control. h, Kaplan-Meier overall survival curves of mice that were orthotopically injected with different primary GB cell lines. i, Kaplan-Meier overall survival curves of mice that were orthotopically injected with 12o15 cells overexpressing GFP or Tau (n=6). j, Kaplan-Meier overall survival curves of mice that were orthotopically injected with 12o02 control or 12o02-shTau cells (n=6). The statistical analysis is shown on the bottom. ****, P ≤0.0001.
